Looking at the same chart, why does one trader see an uptrend and another a downtrend?
After this lesson you will
- Describe a trend by swing structure (HH / HL, LH / LL)
- Understand why a trend always belongs to a specific timeframe
- Know when a trend counts as broken
What is a trend?
A trend is price’s dominant direction over a period of time. There are two common ways to define it:
1. By swing structure.
- Uptrend: each high above the previous high (HH), each low above the previous low (HL).
- Downtrend: lower highs (LH) and lower lows (LL).
- Range: highs and lows with no clear direction.
2. By an indicator rule. For example, price above a long-term moving average, or above a trailing stop line. This is more objective, but it lags.
Why does the trend matter?
- Trading with the trend means being on the same side as the dominant flow; counter-trend trades usually need stronger reasons.
- It defines invalidation. In an uptrend, the latest higher low is the level that, if broken, puts the trend in doubt, and a sensible place for a stop.
- It decides the setup type. Buying a pullback in an uptrend is very different from picking a bottom in a downtrend.
Common misunderstandings
- A trend is a single truth. A trend depends on the timeframe: H1 can be falling while D1 is still rising.
- One red candle ends an uptrend. Pullbacks are normal; a trend breaks only when its structure breaks.
- Eyeballing is enough. Each look can produce different highs and lows. Fixed rules keep you consistent.
- The trend will last. Every trend ends; what matters is having an exit rule.
Chart example
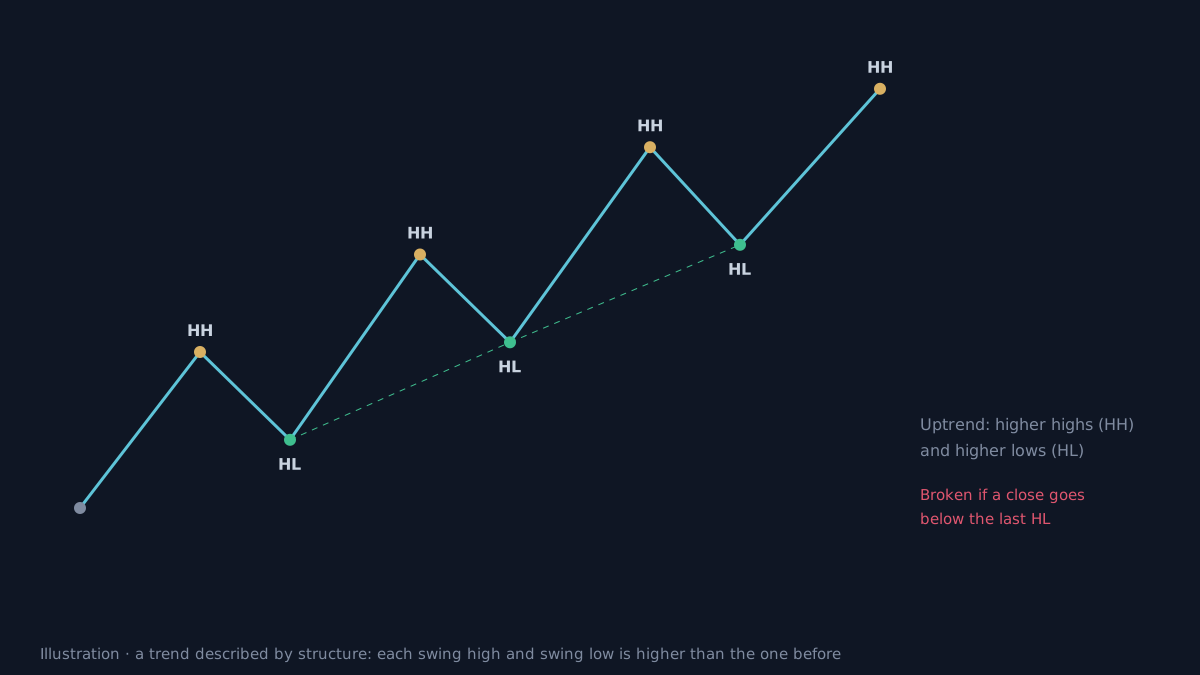 Illustration.
How does AURORA define the trend?
AURORA uses both layers, with fixed rules:
- The long-term trend cycle: a long-term trend filter decides whether the market is in an up or down cycle. BREAK, SUNNY and SMC setups trade only in that direction.
- The short-term trend: the direction of the Kenvin Super Trailing line, which flips when price closes through it.
- Multi-timeframe agreement: the Score counts the share of higher timeframes pointing the same way, using closed higher-timeframe bars only.
You do not need AURORA to apply this: marking HH / HL on your trading timeframe and one higher timeframe is enough to start.
When does a trend count as broken?
- By structure: in an uptrend, a candle closes below the latest higher low. This is often called a break of structure (BOS) in the opposite direction.
- By an indicator rule: price closes through the trend line you use.
- Limits: both methods lag, and in ranging markets both give many false reversals.
Practical checklist
- State the timeframe whenever you talk about a trend.
- Mark the latest swing high and swing low to define the structure.
- Choose one trend definition and stay consistent.
- Decide in advance which level, if broken, ends the trend.
- Trade with the higher-timeframe trend when you can.
Video Explainer
The video for this article is in production. The full written lesson is already complete.
Video chapters
- Same chart, two opinions
- Trend by swing structure
- Trend by rules
- Trends depend on the timeframe
- When a trend breaks
Show transcript
Product documentation
Educational and decision-support content, not investment advice. Chart examples are illustrative or historical and do not guarantee future results. Trading carries a risk of capital loss.