Latest explainers
The newest library explainers, each with a video, chapters and transcript.
JSON alerts and webhooks: sending AURORA signals to a bot
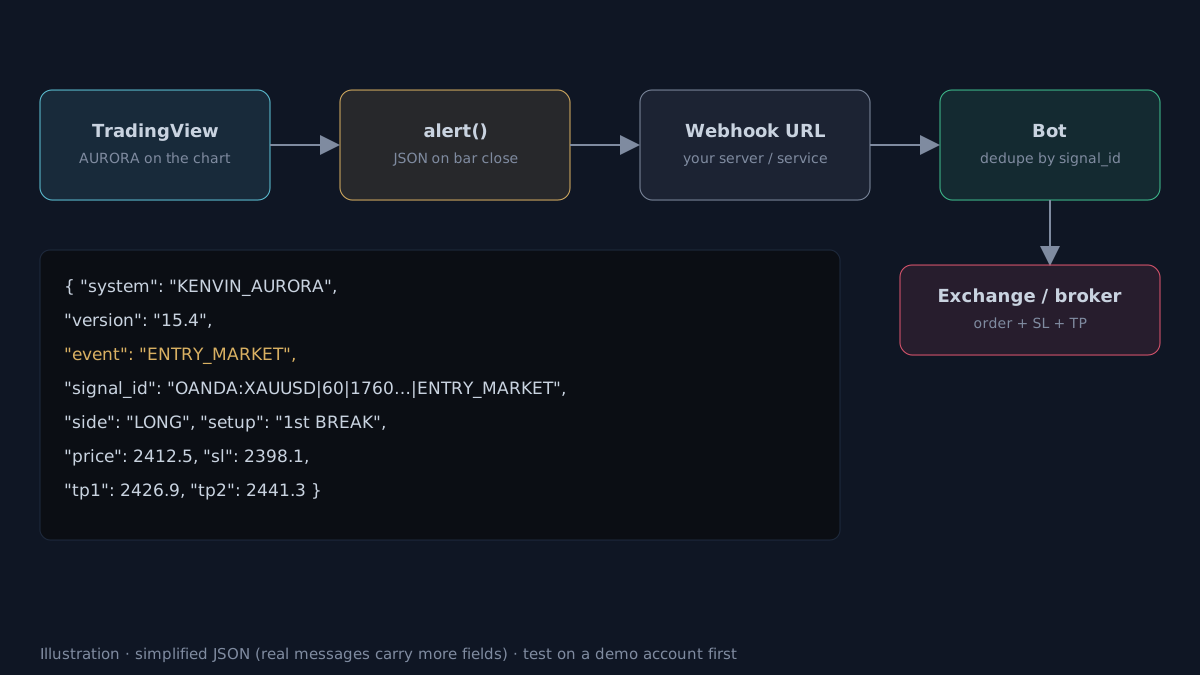
AURORA has two kinds of alert: setup alerts for entering trades yourself, and JSON alerts sent by webhook so a bot can read the entry, stop, targets and de-duplication ID of each event.
What is ATR?
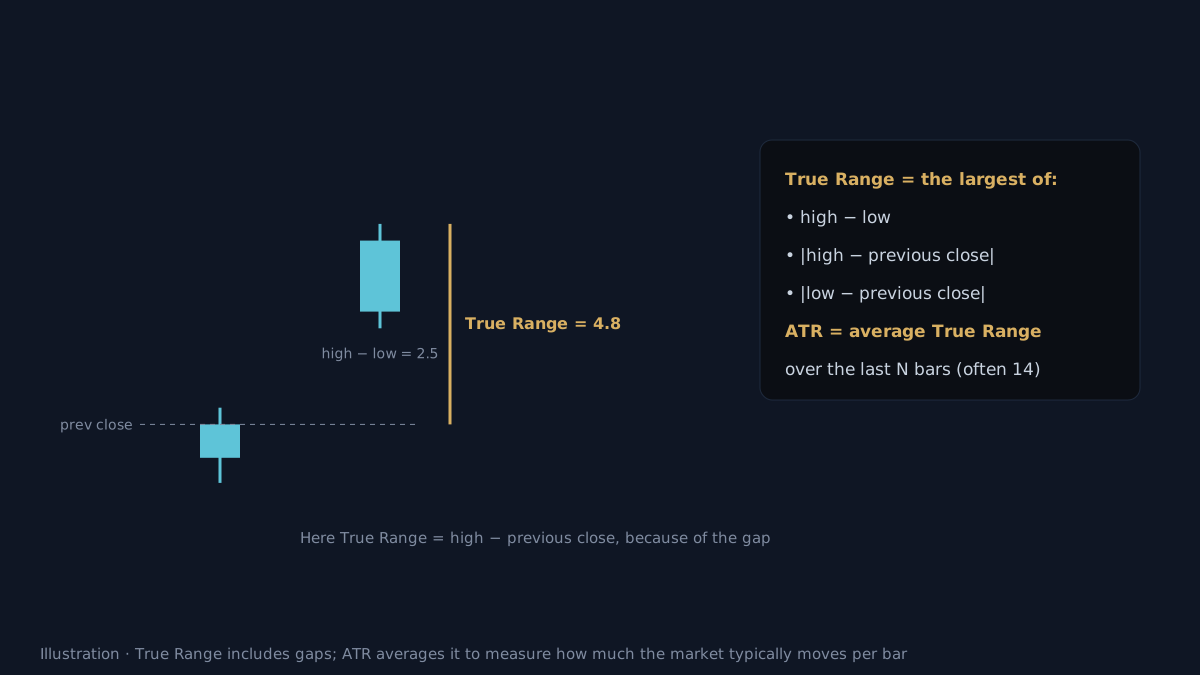
ATR (Average True Range) is the average price range over the last N bars, used to measure volatility and set stop distances that fit the market.
Win rate vs Avg R: which number matters more?
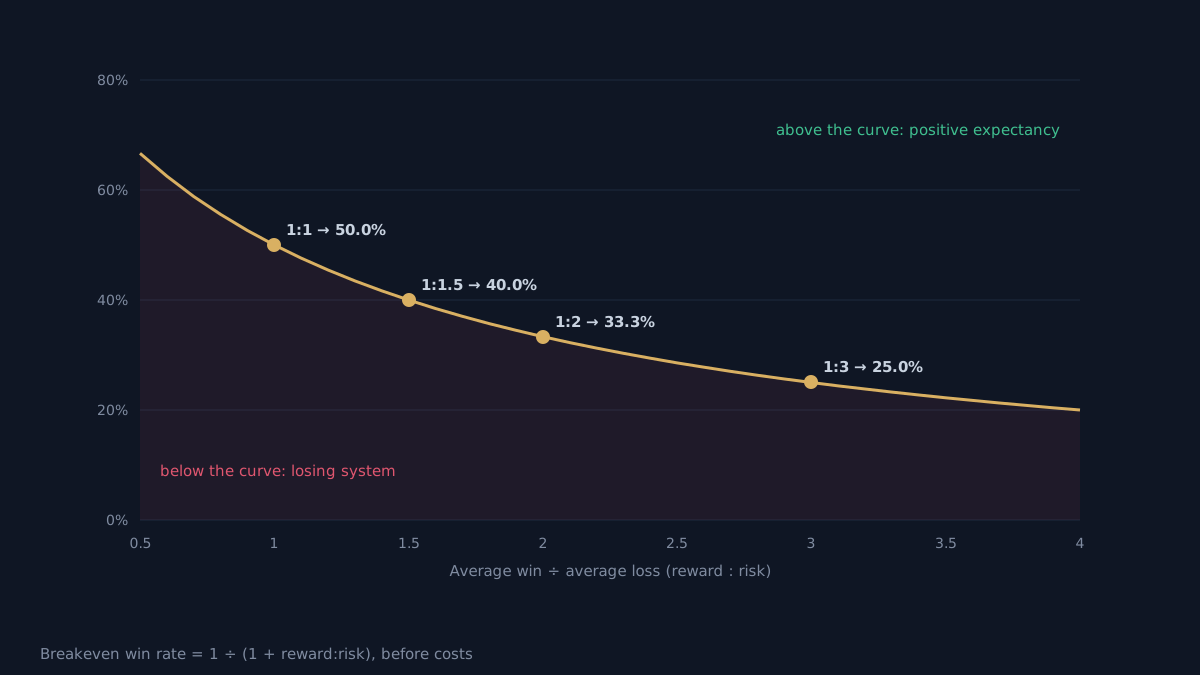
Win rate only means something alongside the average win and loss; average R per trade (expectancy) combines both and decides whether a system has an edge.
Why wait for the bar to close before trusting a signal?
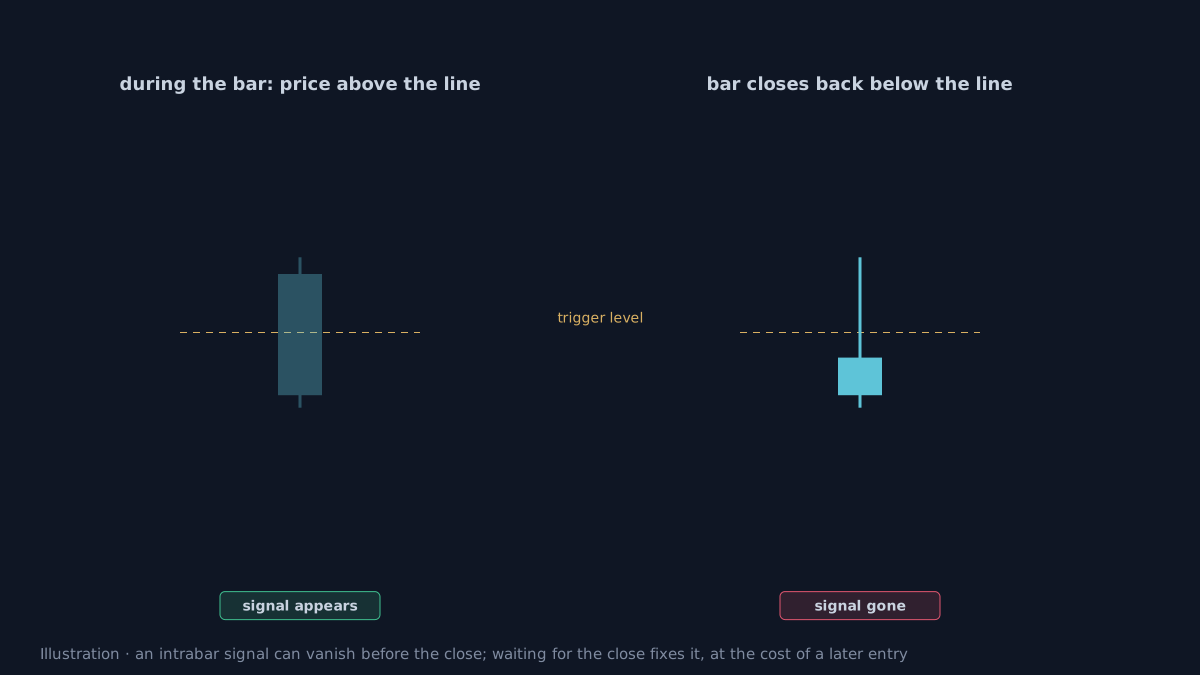
Bar-close confirmation means treating a signal as real only once its candle has finished; the signal then no longer changes, at the cost of arriving a little later.
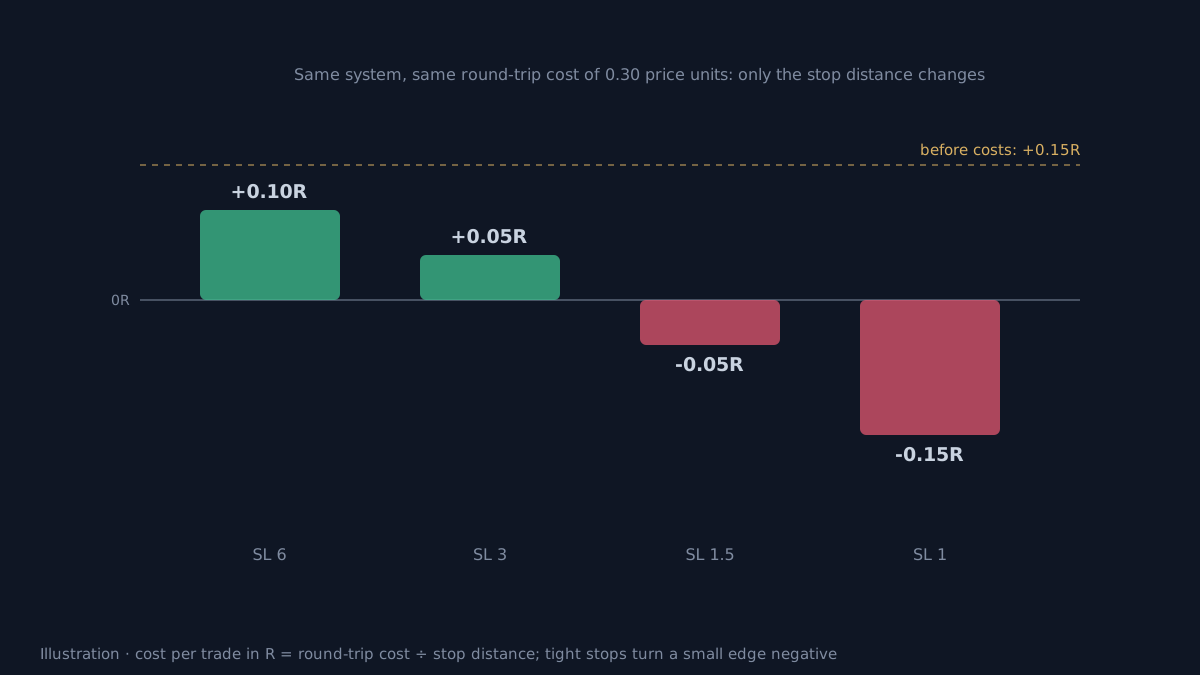
Commission and slippage: how a small edge disappears
Commission and slippage are deducted from every trade; in R, cost equals the round-trip cost divided by the stop distance, so the tighter the stop, the more costs eat the edge.
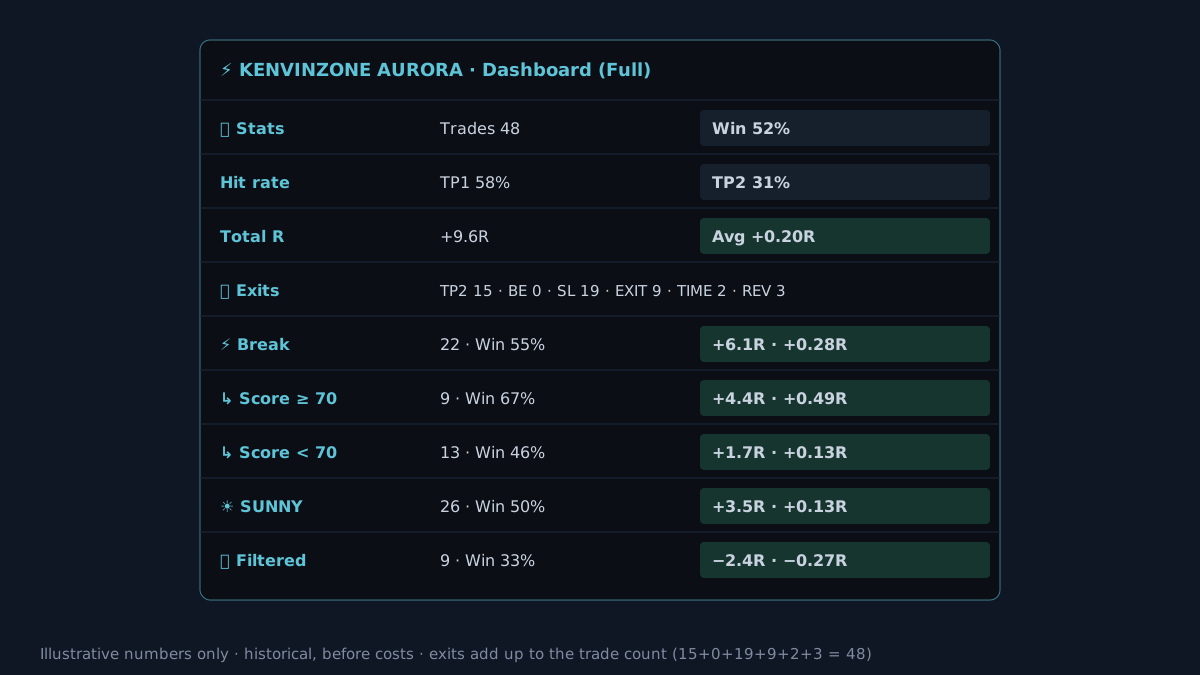
How do you read the statistics dashboard correctly?
AURORA's statistics dashboard records trade-plan results on the loaded chart history; reading it correctly starts with average R and trade count, not win rate.
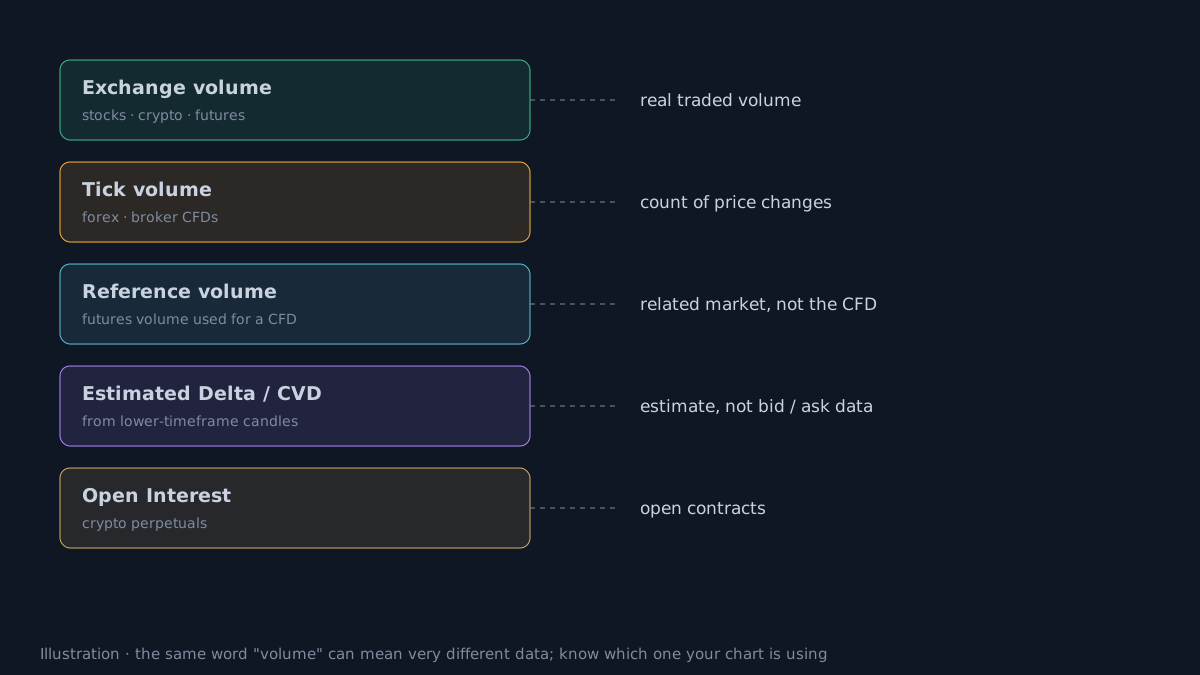
Data provenance: knowing where your chart's numbers come from
Data provenance means knowing how each number on a chart is produced: real exchange volume, a broker's tick volume, reference volume from another market, or an estimate.
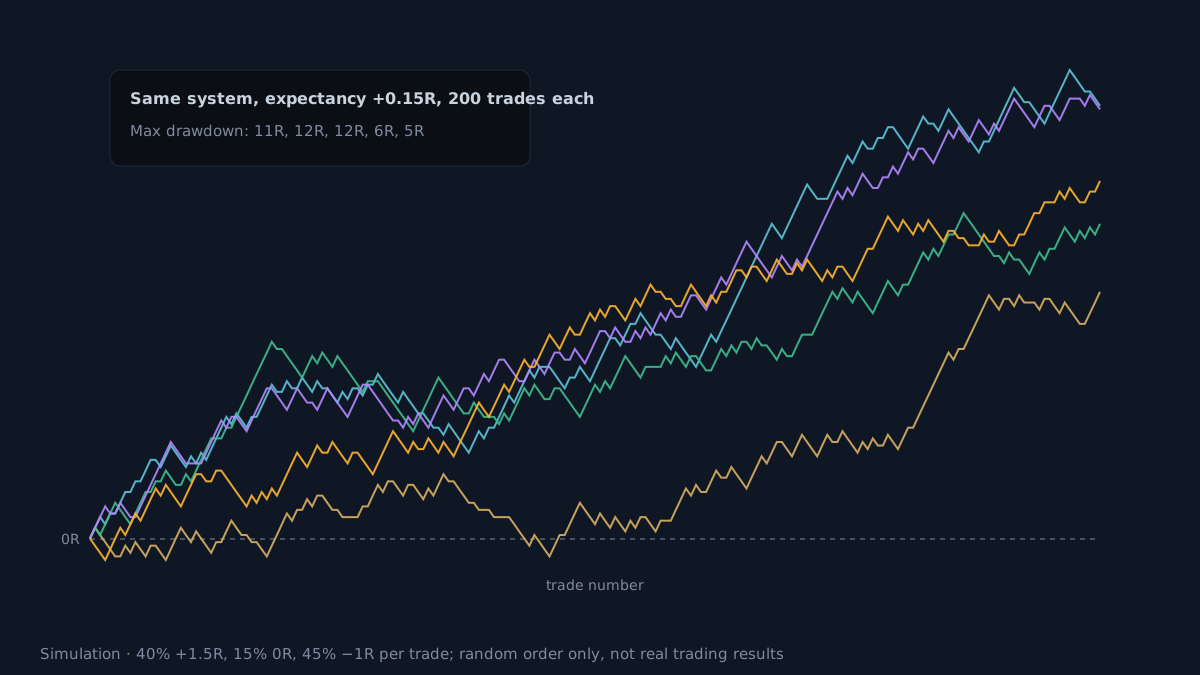
What is drawdown?
Drawdown is the drop from an equity peak to the following trough; it shows how deep a losing stretch you must sit through, and it depends directly on your risk per trade.
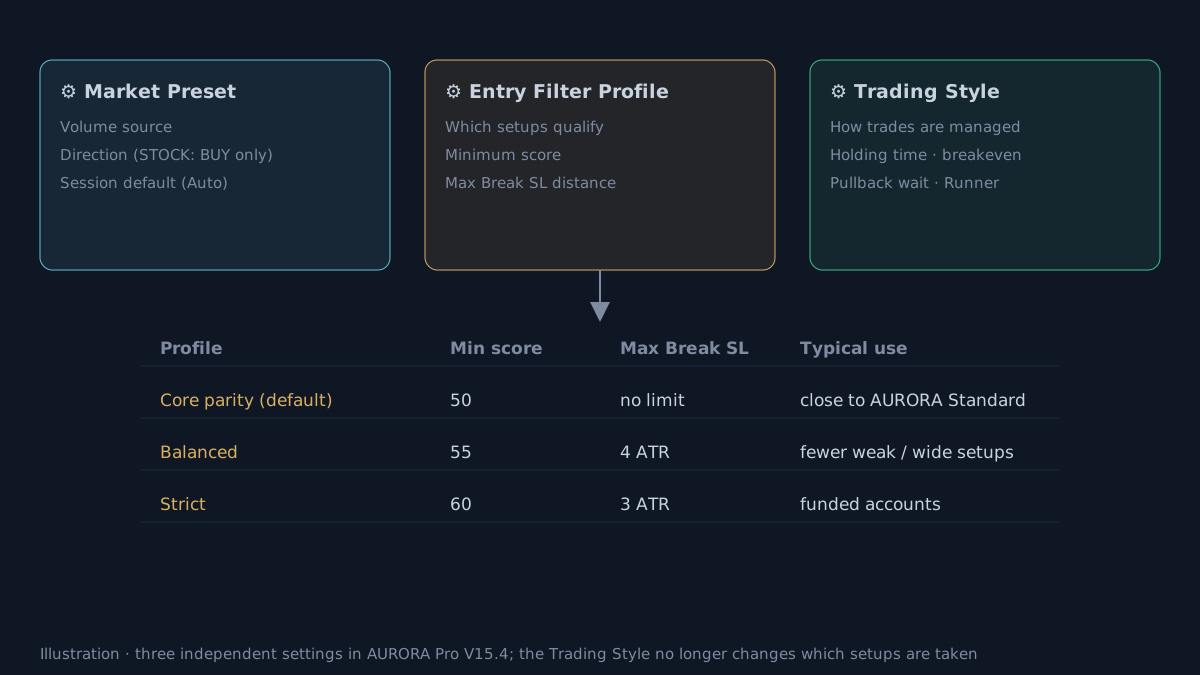
Entry Filter Profile: choosing how selective setups are
The Entry Filter Profile is the AURORA Pro setting that decides which setups qualify for entry, through a minimum score and a maximum Break stop distance, independently of trade management.
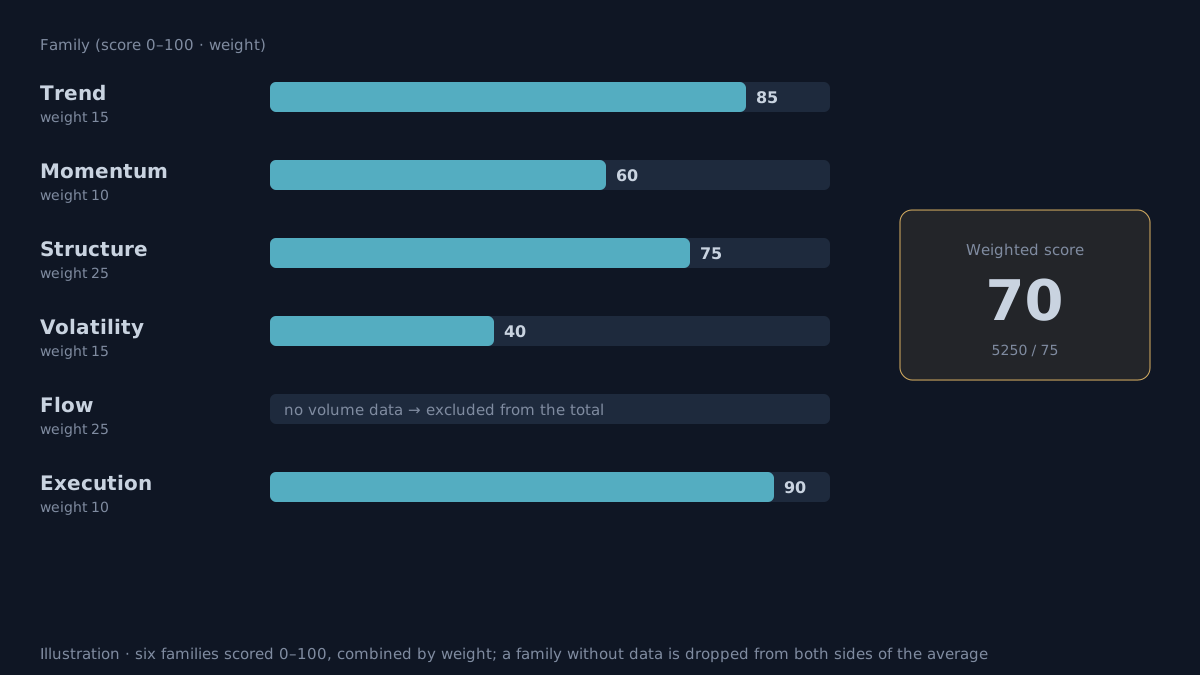
How does Family Score work?
Family Score rates the trading context from 0 to 100 using six independent families: Trend, Momentum, Structure, Volatility, Flow and Execution, combined by weight.
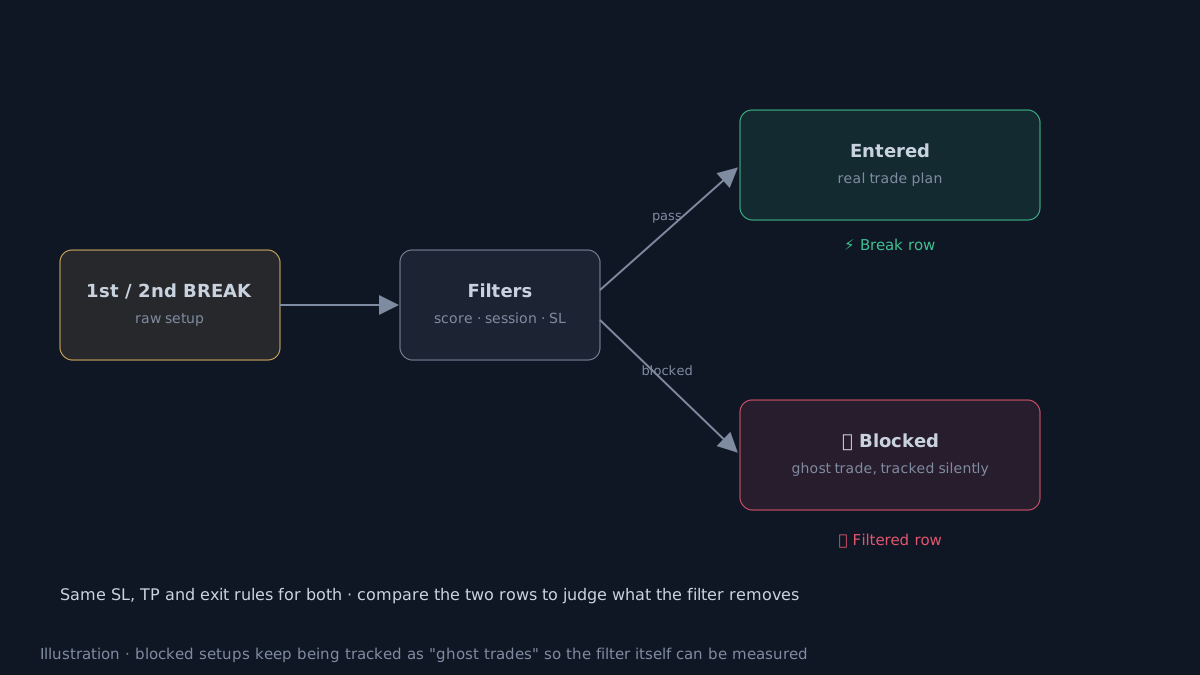
Filtered and ghost trades: measuring what a filter is really worth
A ghost trade is a setup blocked by a filter but still tracked in the background as if taken, to see whether the filter removes bad trades or blocks good ones.
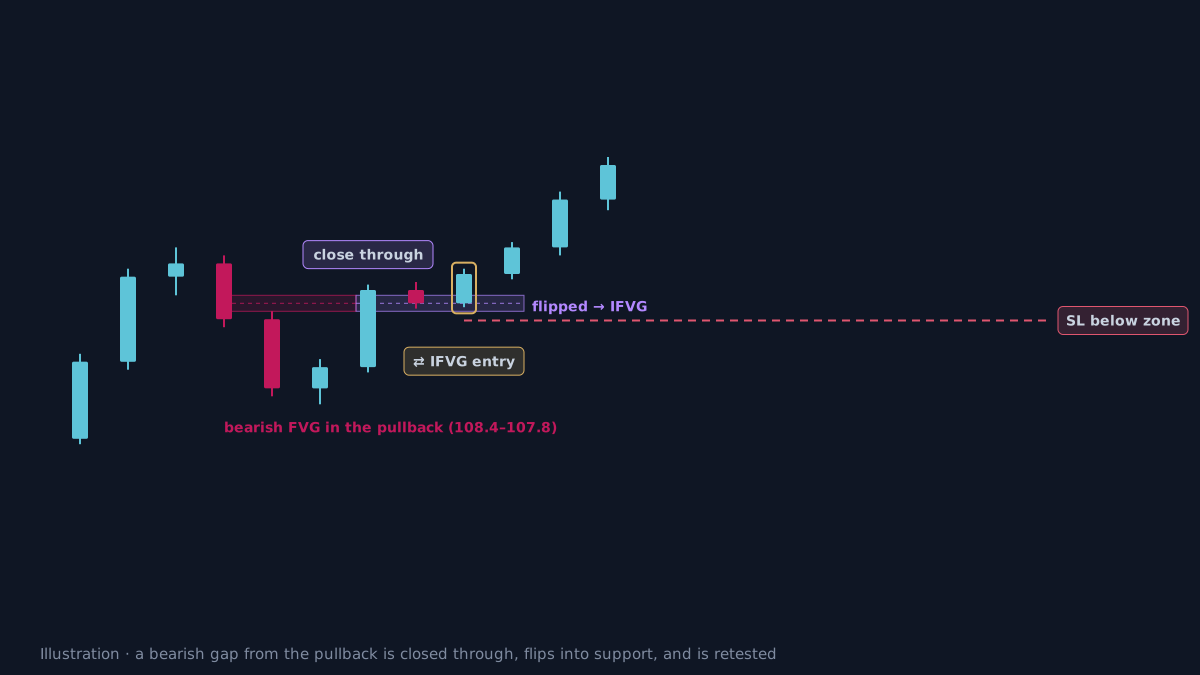
What is an IFVG? When a price gap flips its role
An IFVG (Inverse FVG) is an opposite-direction FVG that price closes through and that flips role: former resistance becomes support, and vice versa.
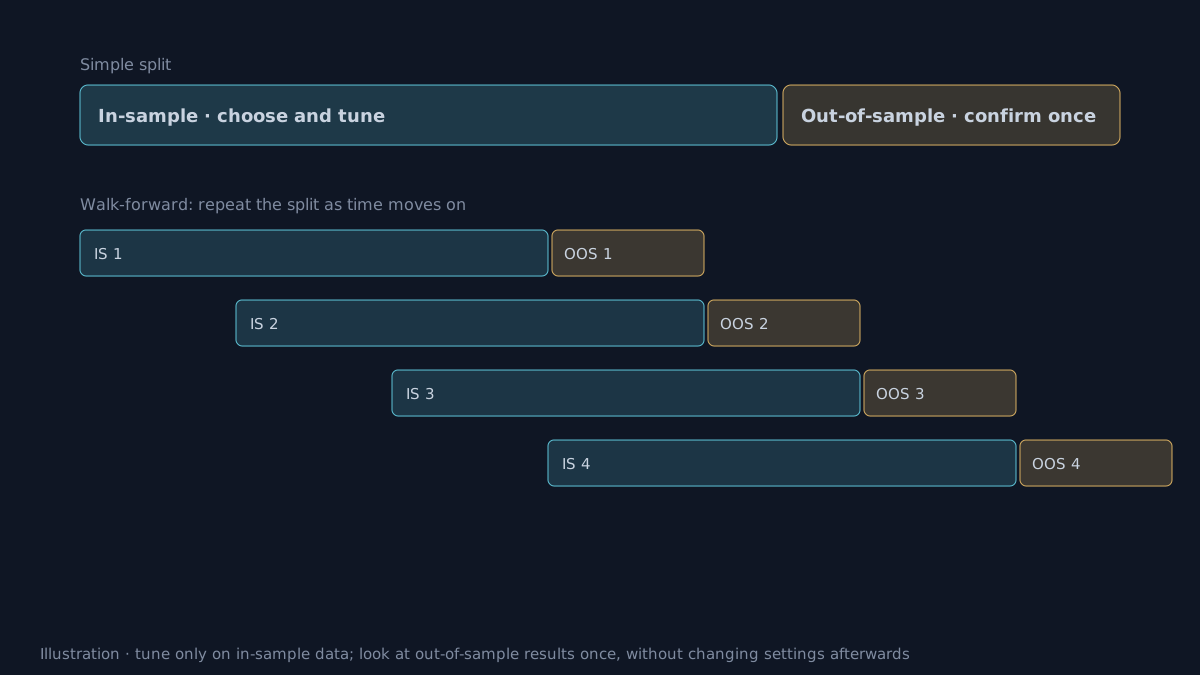
In-sample and out-of-sample
In-sample is the data used to choose settings; out-of-sample is data set aside and used only to check whether the chosen settings still work on unseen data.
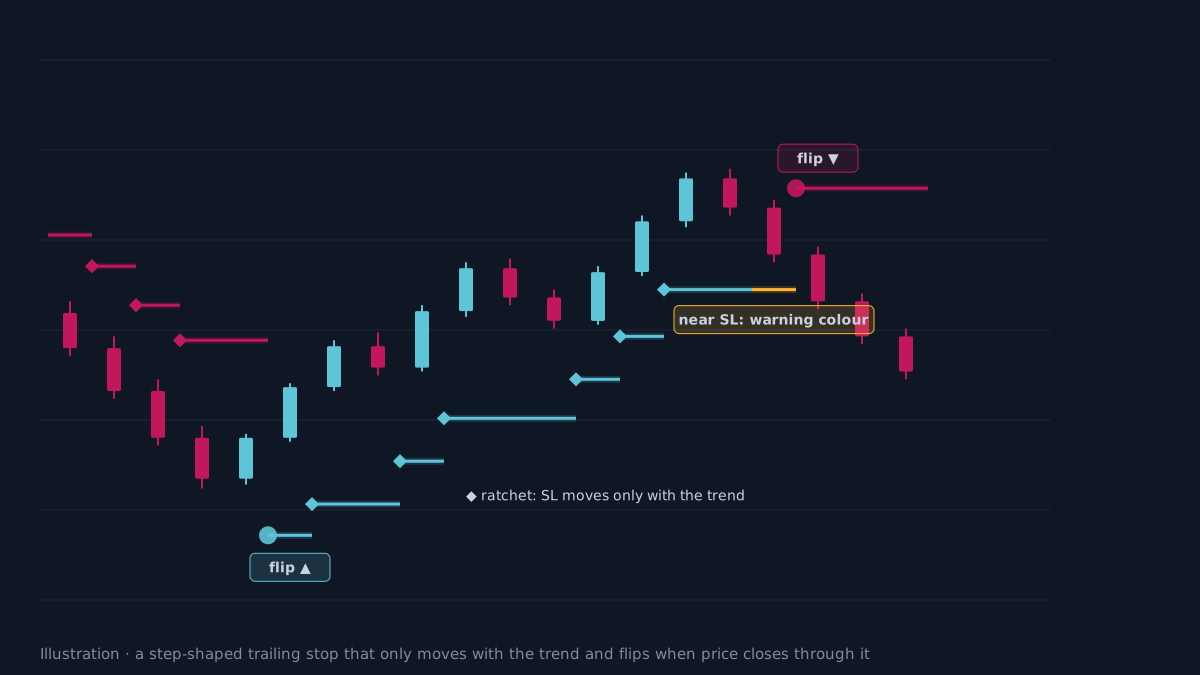
How does the Kenvin Super Trailing line work?
Kenvin Super Trailing is a step-shaped dynamic stop line built from pivot points and ATR; it only moves with the trend and flips when price closes through it.
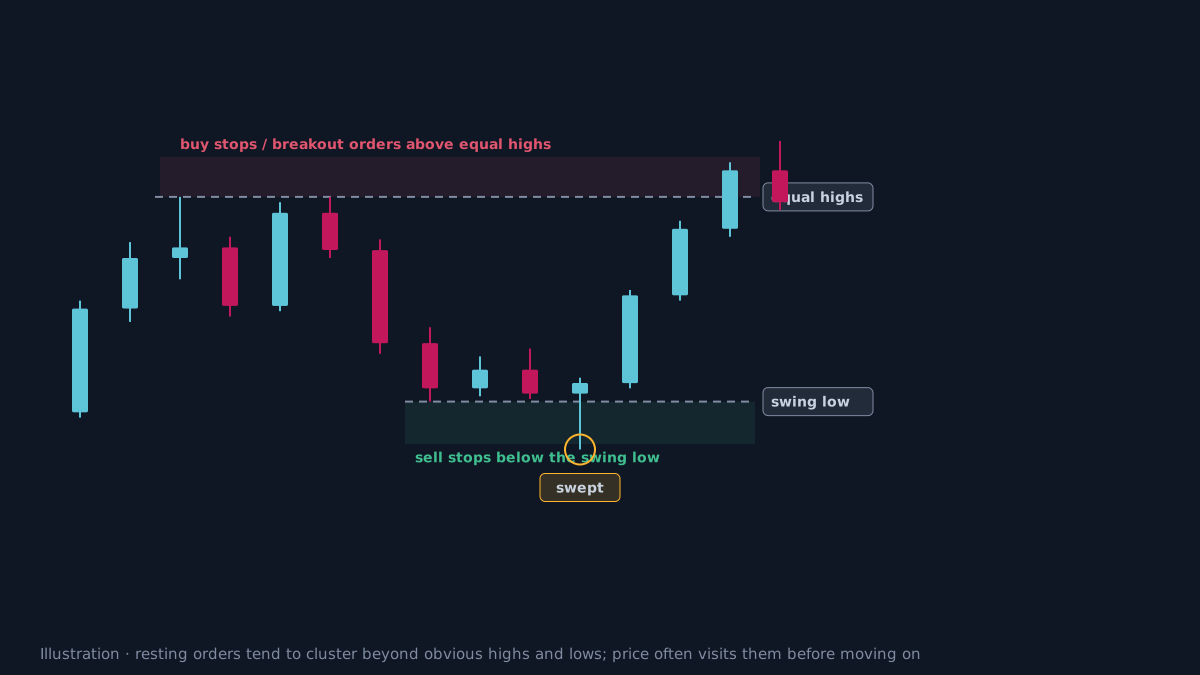
Where is the liquidity on a chart?
On a chart, liquidity usually means areas where resting orders cluster around obvious highs and lows; price often sweeps them before continuing or reversing.
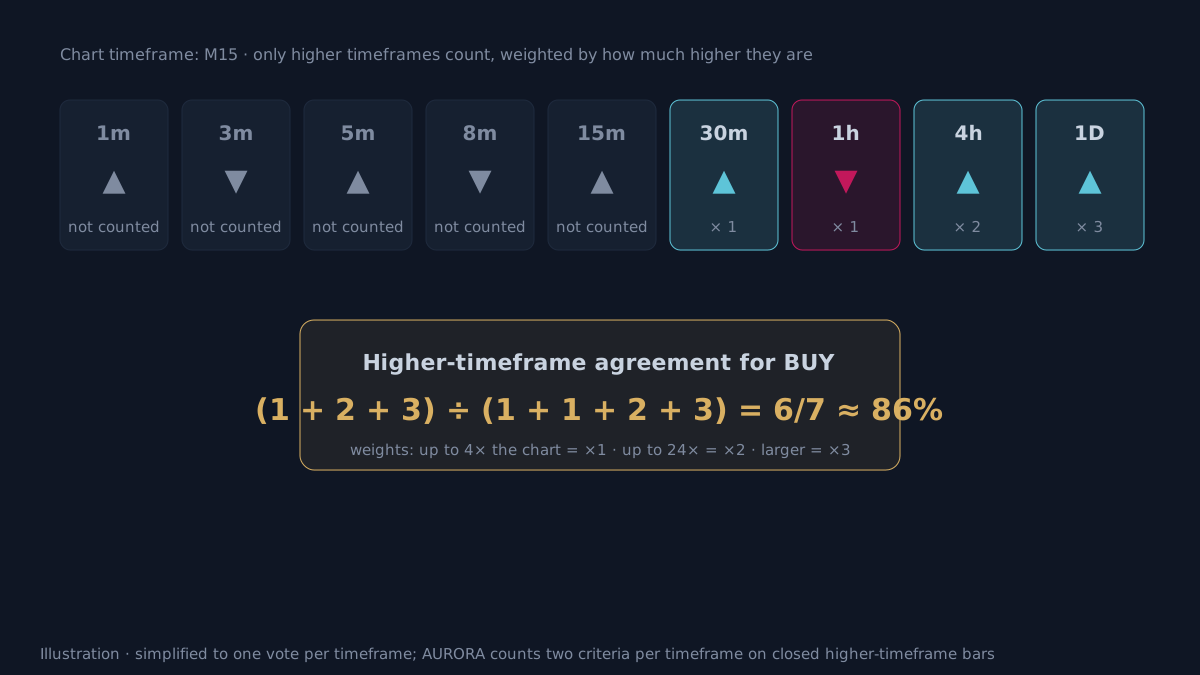
Multi-timeframe context
Multi-timeframe analysis reads the trend on higher timeframes for context, then uses the trading timeframe to time entries in that direction.
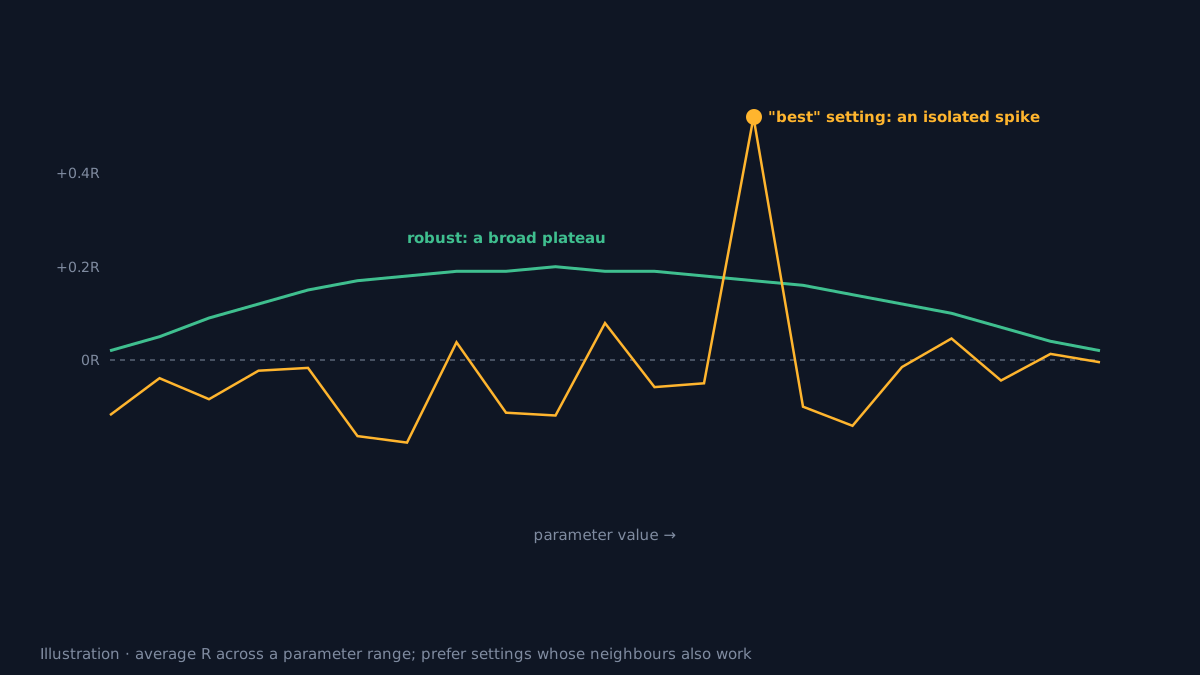
Overfitting: when a system is only good at the past
Overfitting is when settings are tuned so closely to past data that they capture random noise, so results look great historically but disappoint on new data.
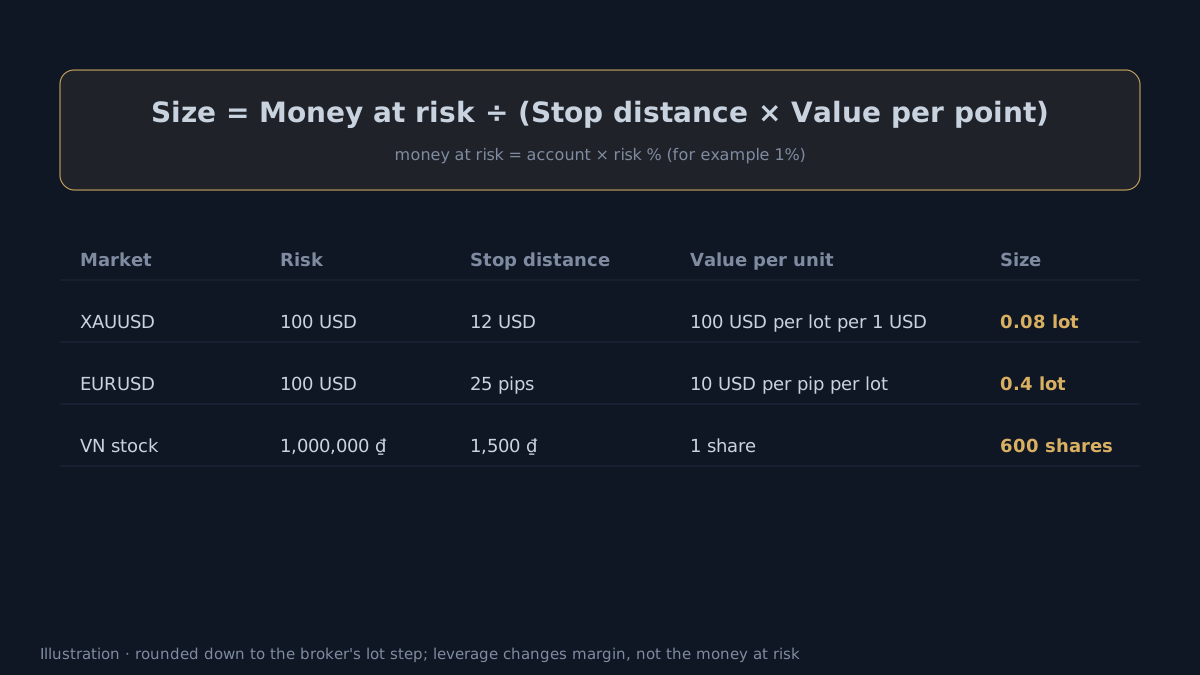
How do you size a position?
Position sizing works back from the money you accept to lose and the distance to the stop, instead of trading the same fixed size on every trade.
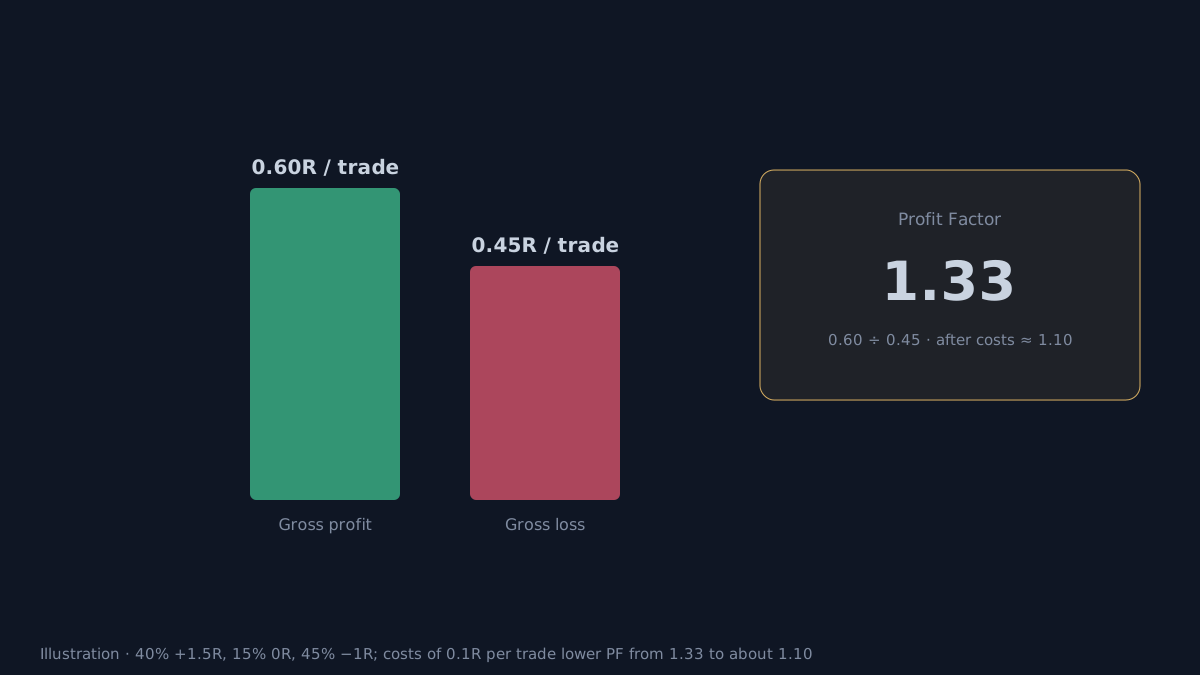
What is Profit Factor?
Profit Factor is gross profit divided by gross loss over the tested period; above 1 means profitable on that data, but it must be read with sample size, drawdown and costs.
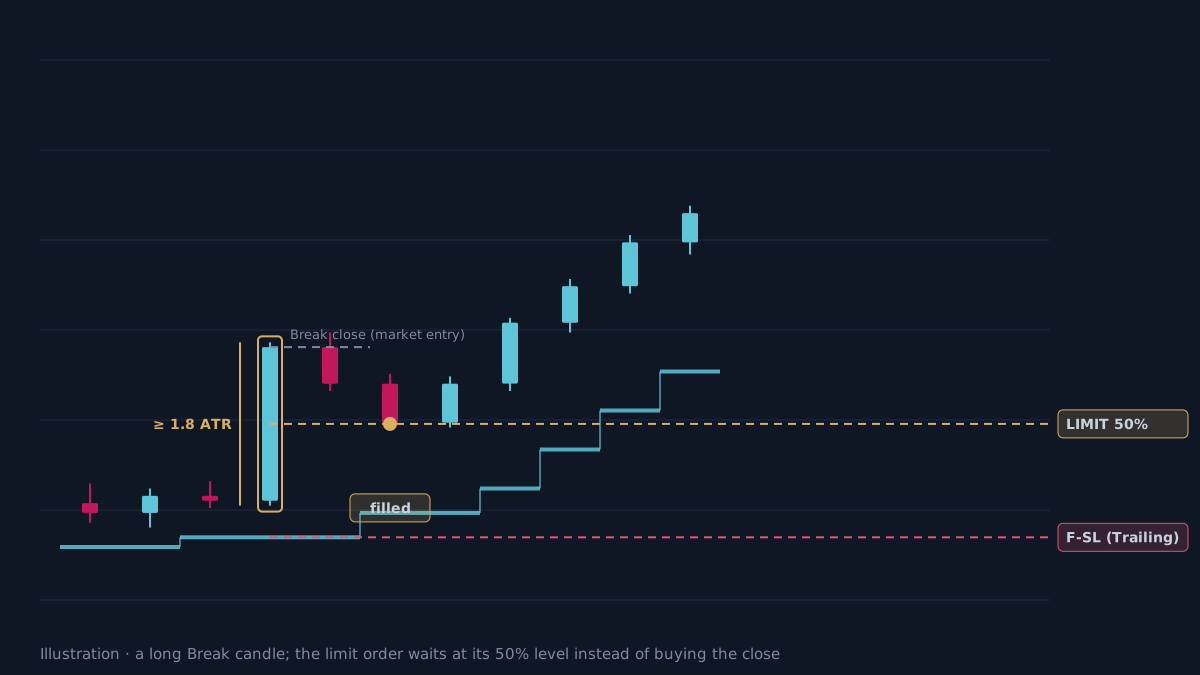
Pullback Entry for long breakout candles
Pullback Entry places a limit order at the 50% retracement of an overly long breakout candle instead of entering at that candle's close.
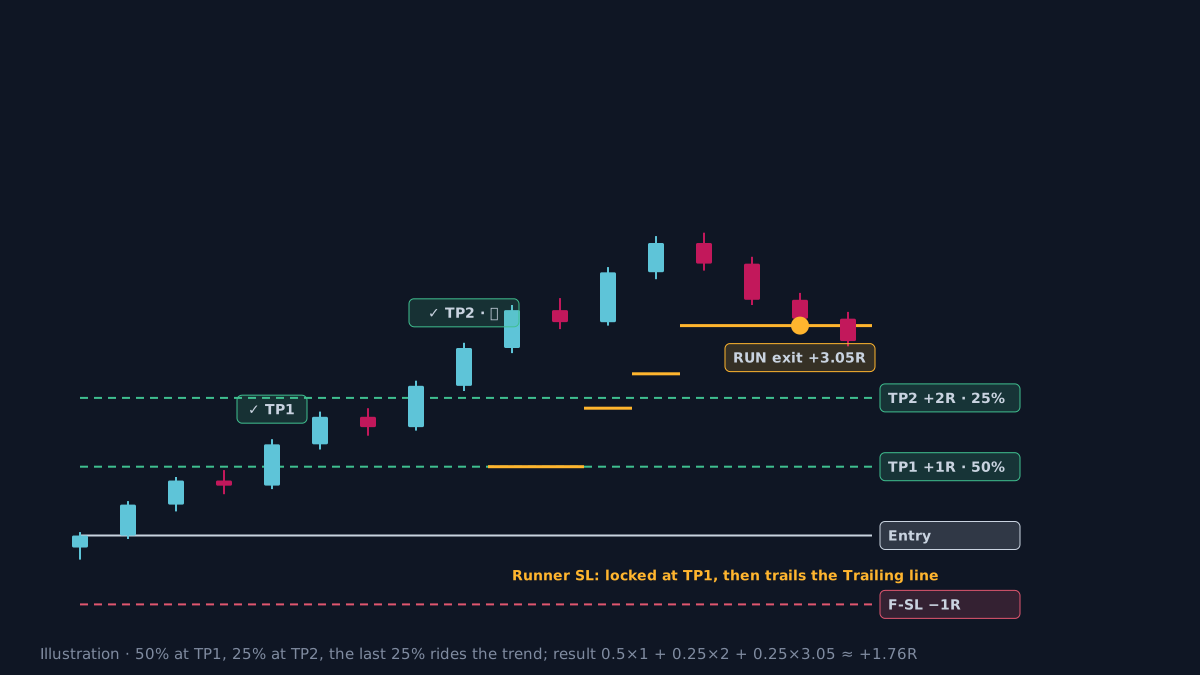
The Runner after TP2: keeping part of the trade for the trend
The Runner is the 25% of the position kept after TP2, with its stop locked at TP1 and then trailing the Trailing line, to capture trends that run beyond 2R.
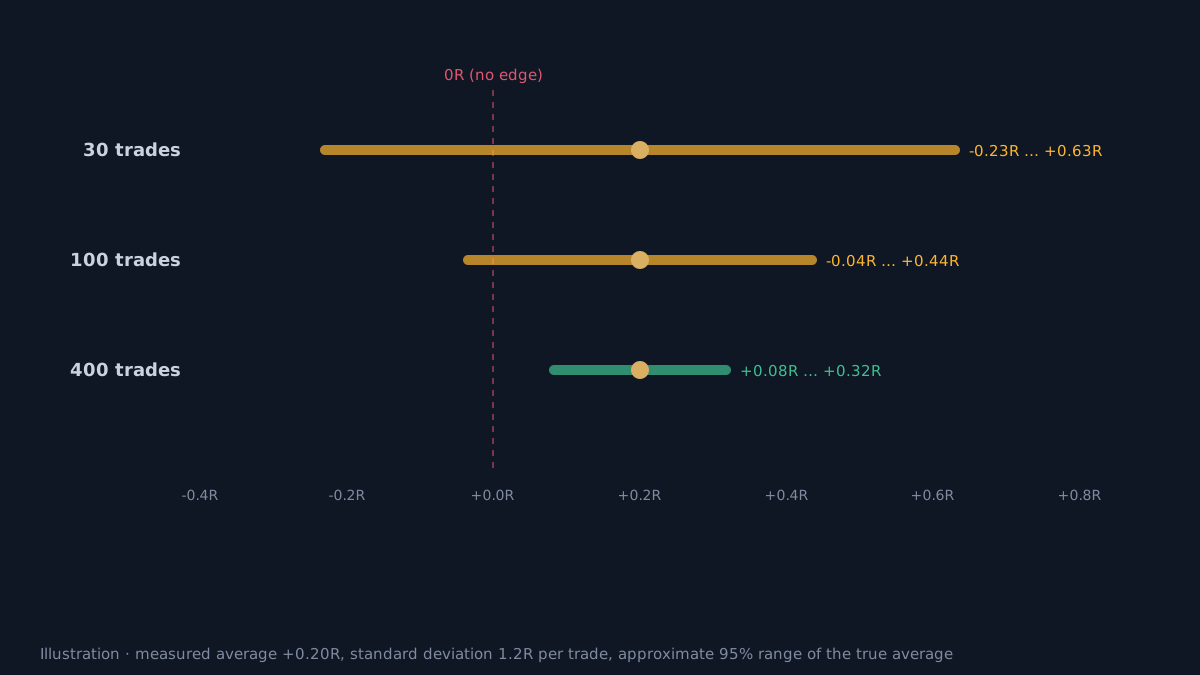
How many trades are enough to conclude anything?
Sample size is the number of trades used to judge a system; the smaller the sample, the more the measured average R swings, and the harder it is to tell a real edge from luck.
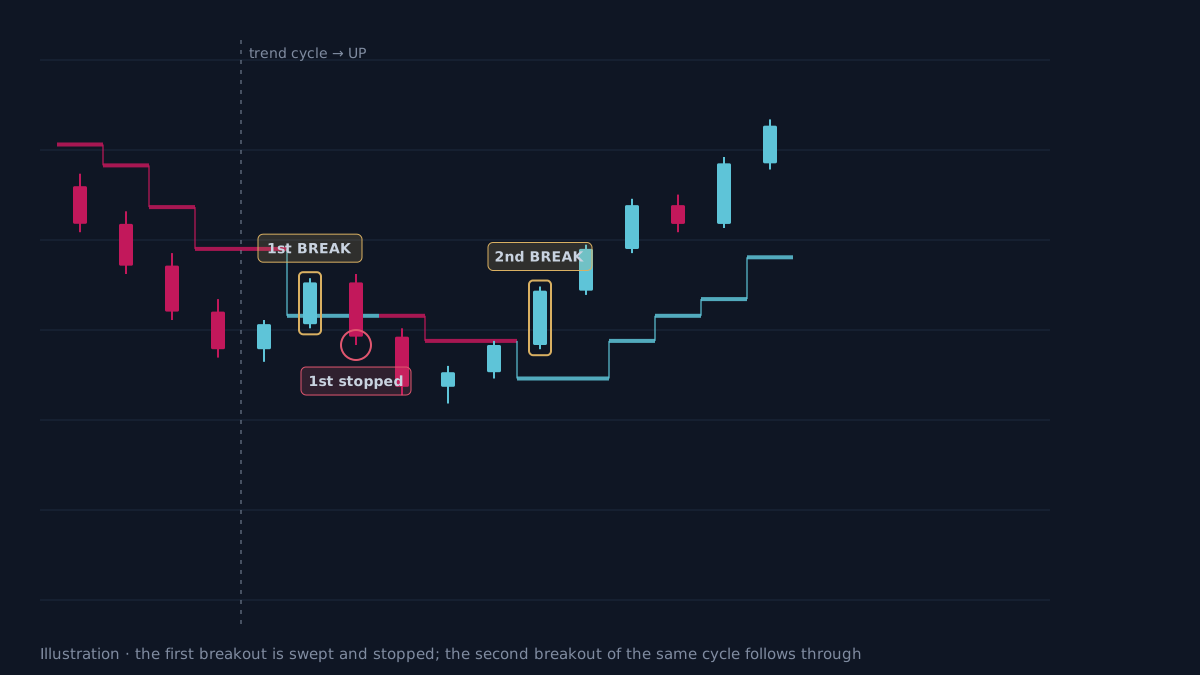
What is the 2nd BREAK?
The 2nd BREAK is the second time price breaks back through the Trailing line in the direction of the same trend cycle, often after the first breakout was swept.
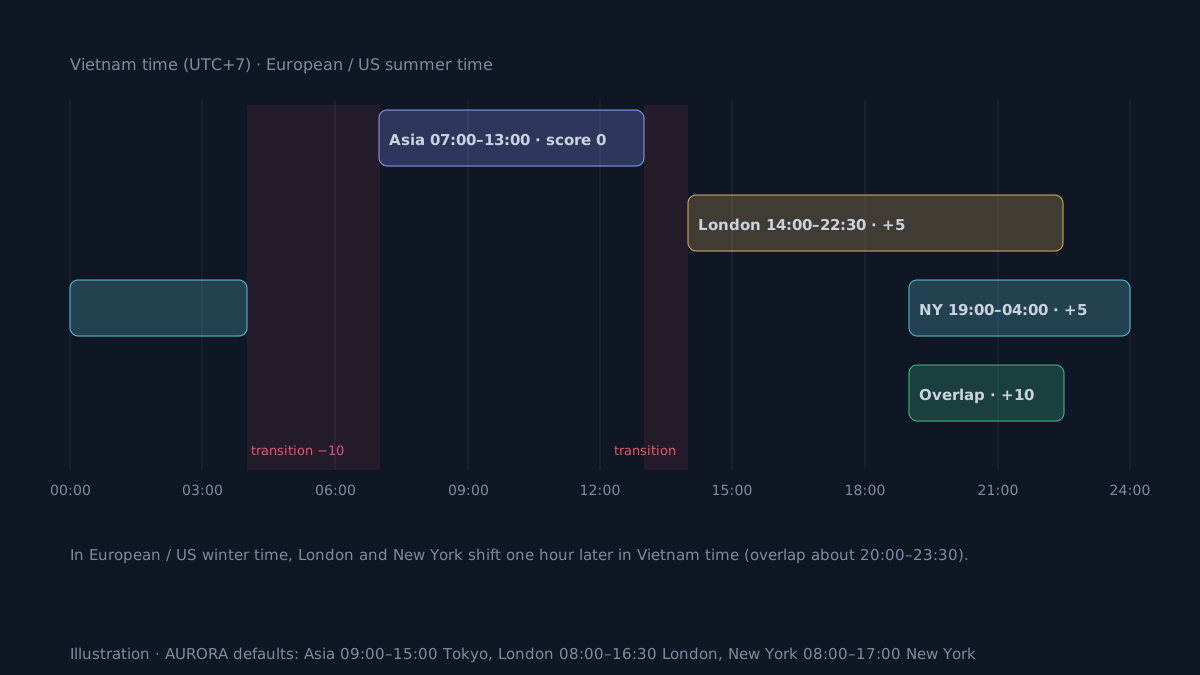
How do trading sessions affect signals?
Trading sessions are the hours when the world's main markets are open; liquidity and volatility differ by session, so the same signal can perform differently.
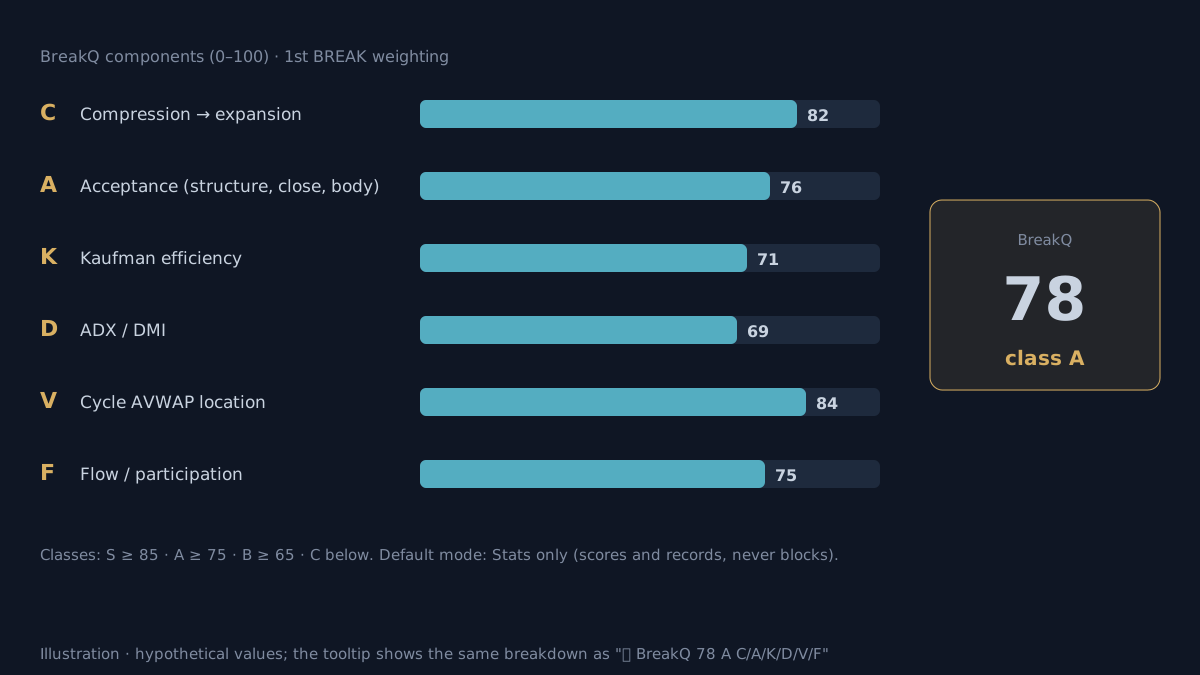
Setup Quality: scoring each BREAK and SUNNY on its own
Setup Quality is a score for each individual BREAK or SUNNY setup, measuring compression then expansion, candle decisiveness, path efficiency and location in the trend.
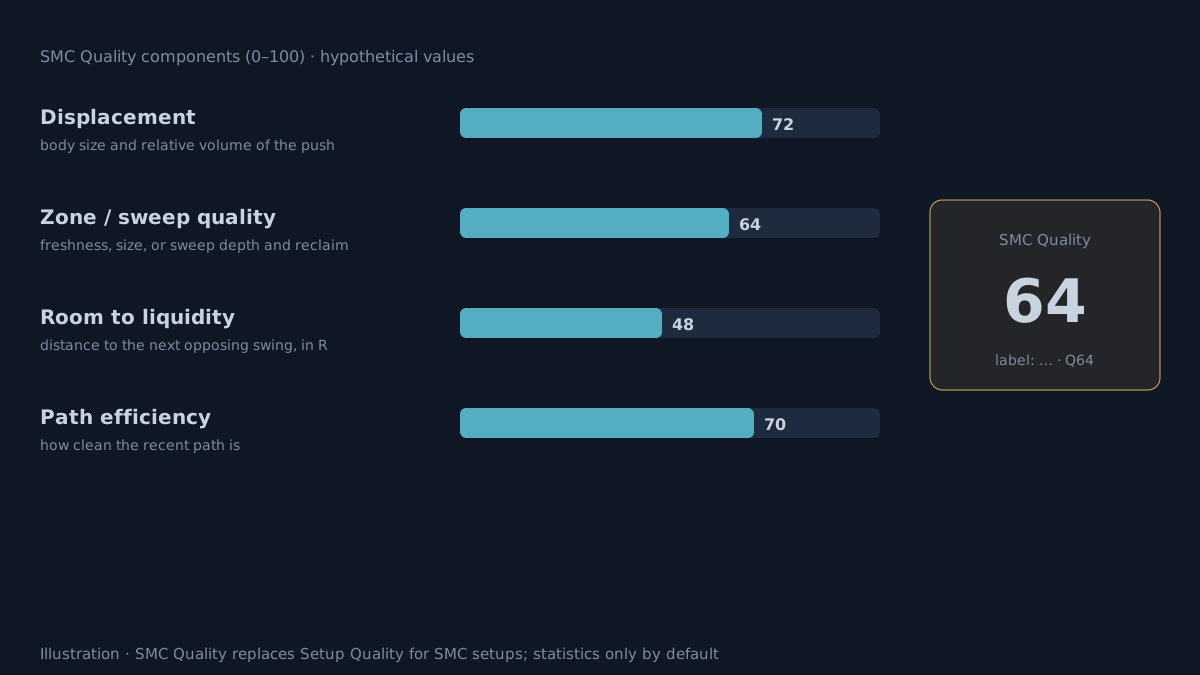
SMC Quality: scoring SMC setups
SMC Quality is a 0–100 score for each SMC setup, built from displacement, zone or sweep quality, room to the opposing liquidity in R, and path efficiency.
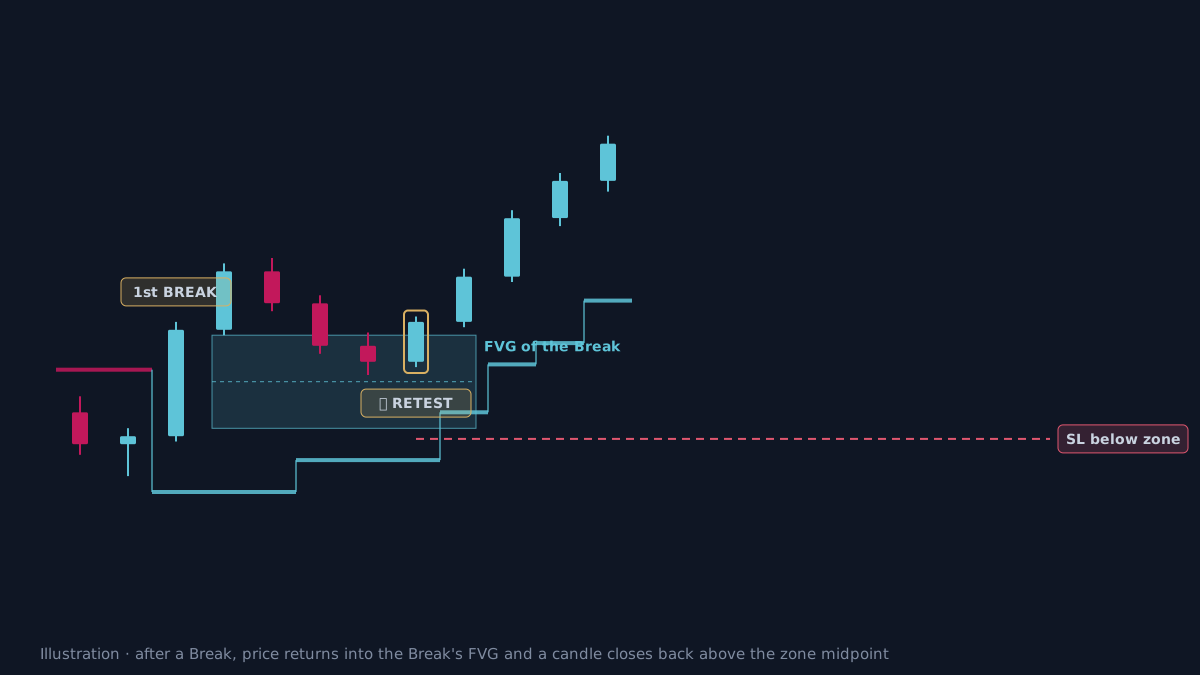
SMC RETEST: entering when price returns to the breakout's zone
SMC RETEST is a setup that enters when price returns into the FVG (or Order Block) left by a Break, and a candle closes back beyond the zone midpoint in the trend direction.
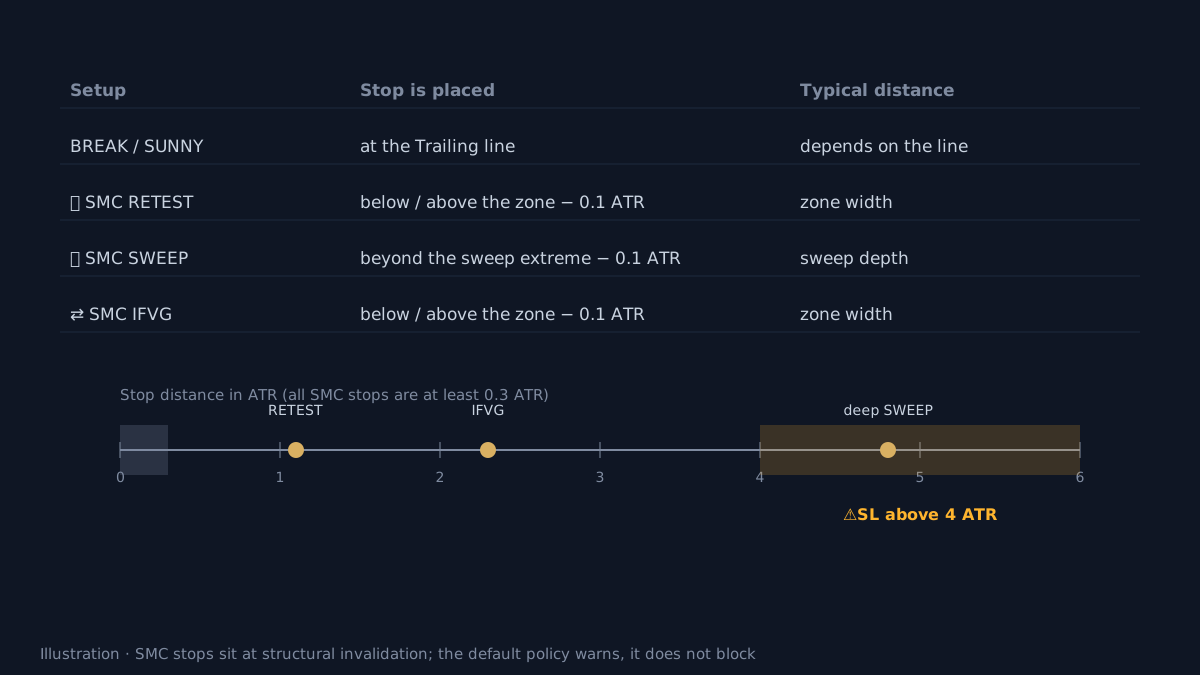
Structural stops: placing the stop where the idea is really wrong
A structural stop sits at the setup's own invalidation level, such as beyond an FVG zone or beyond a sweep's extreme, rather than at a general trailing line.
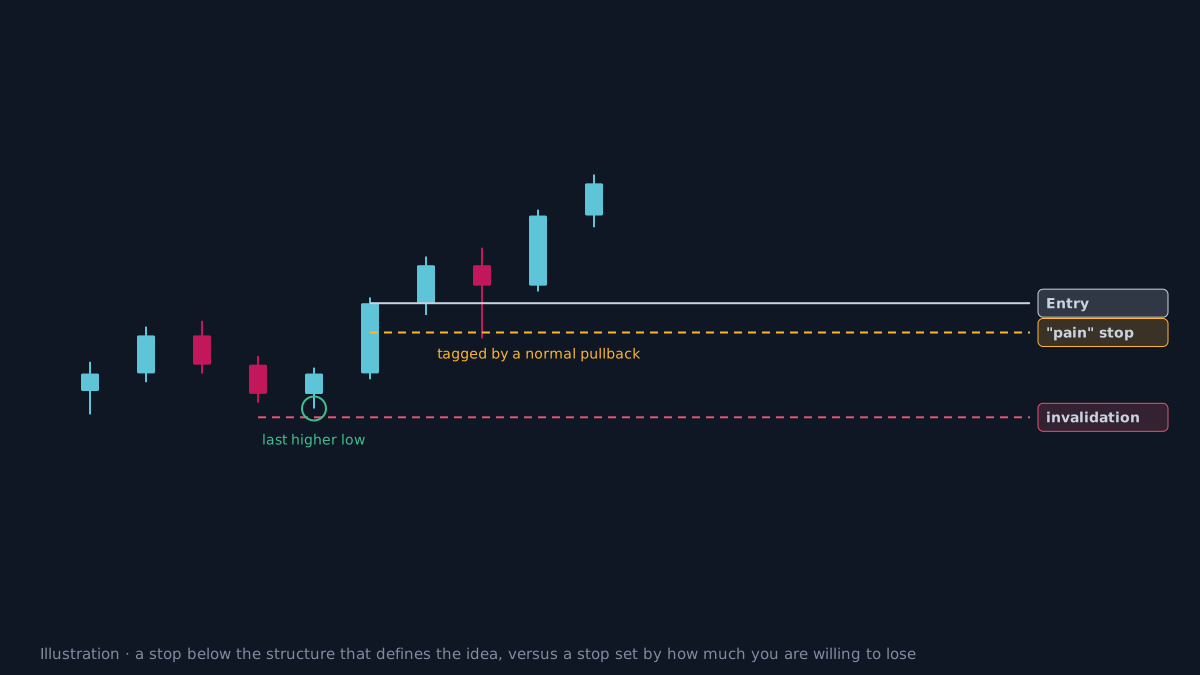
What is a stop loss?
A stop loss is a price decided in advance at which the trade is closed because the idea is wrong, capping the loss at an acceptable amount.
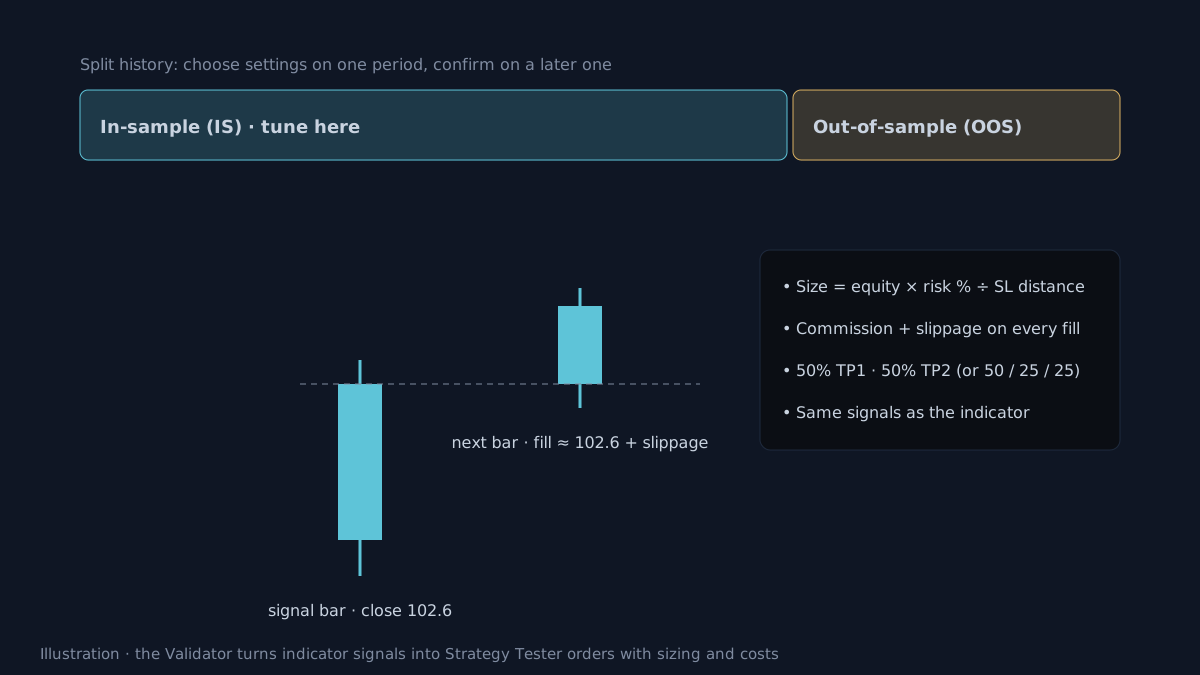
Strategy Validator: testing AURORA with costs and realistic fills
The Strategy Validator is AURORA's strategy version: the same signals run in TradingView's Strategy Tester with risk-based sizing, next-bar fills, commission and slippage.
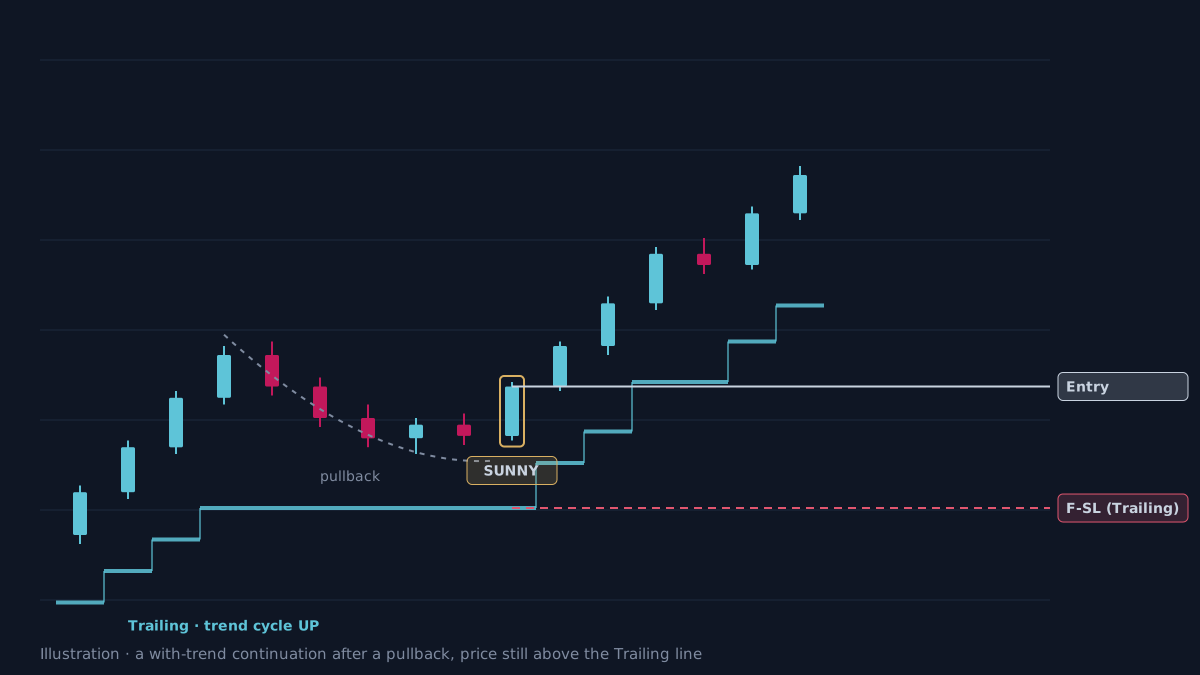
What is SUNNY?
SUNNY is a setup that enters when the market turns back in the main trend direction after a pullback, with price still on the right side of the Trailing line.
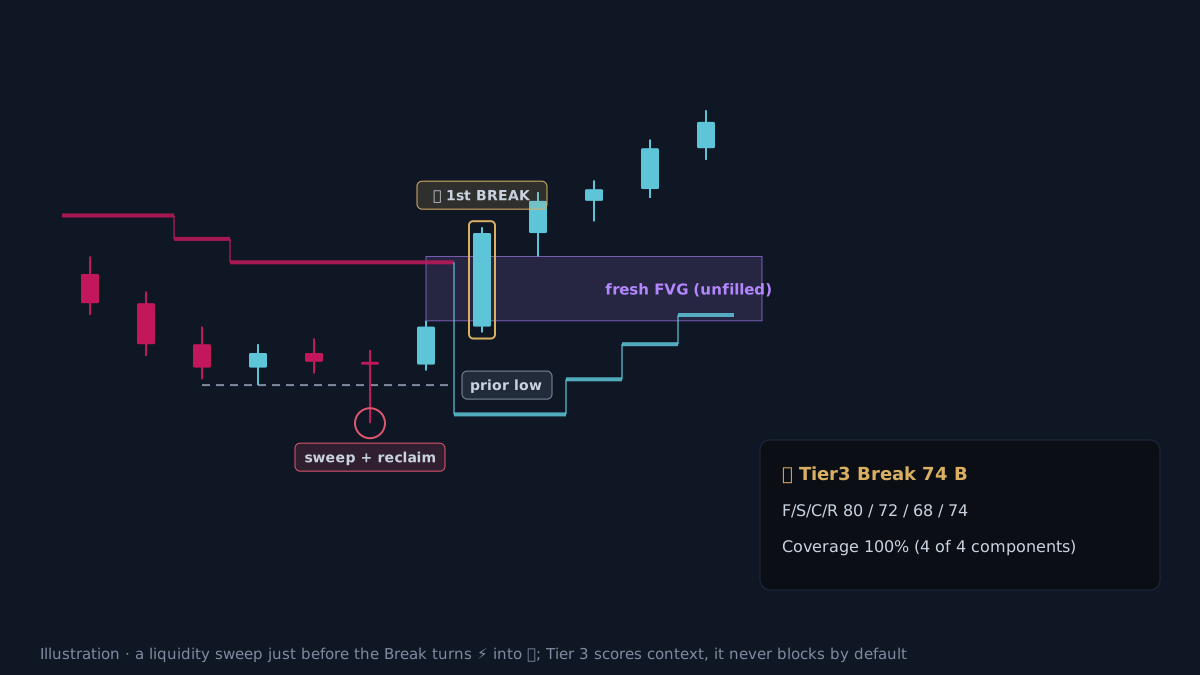
Tier 3: traces of large money flow around a setup
Tier 3 is AURORA Pro's context layer, looking for traces of large money flow around a setup: fresh FVGs, liquidity sweeps, CVD and absorption, plus suitability for holding a Runner.
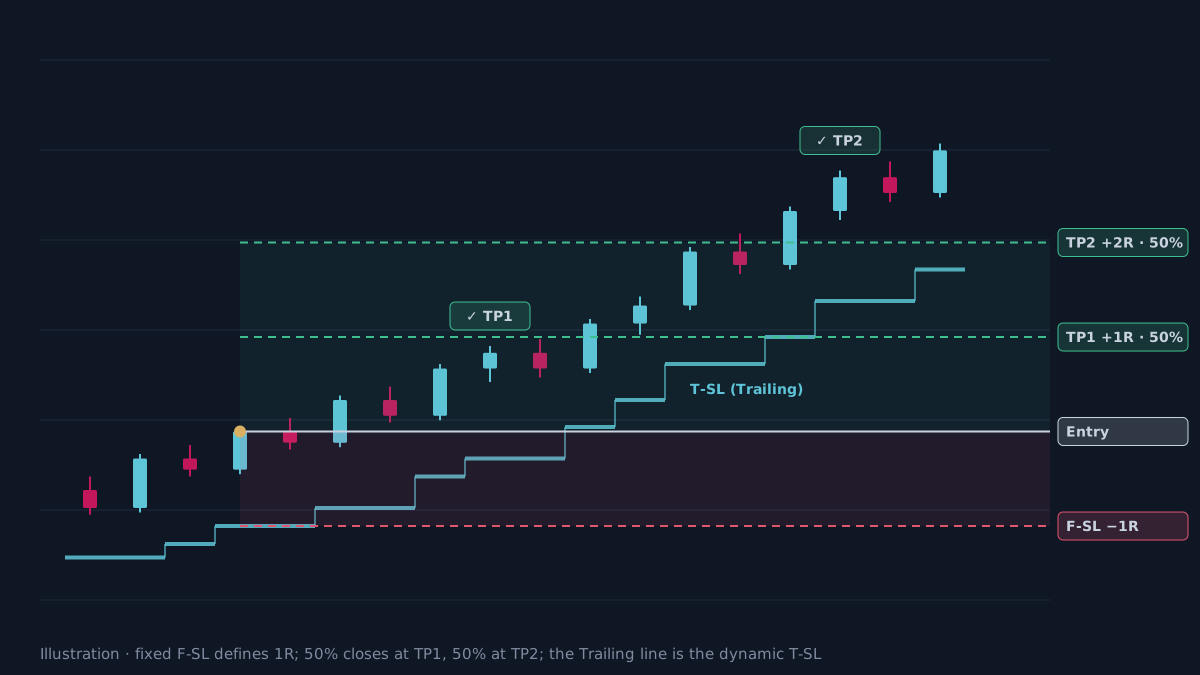
What goes into a trade plan?
A trade plan is a set of decisions locked in before entry: entry price, stop loss, size, where to take profit and when to exit early.
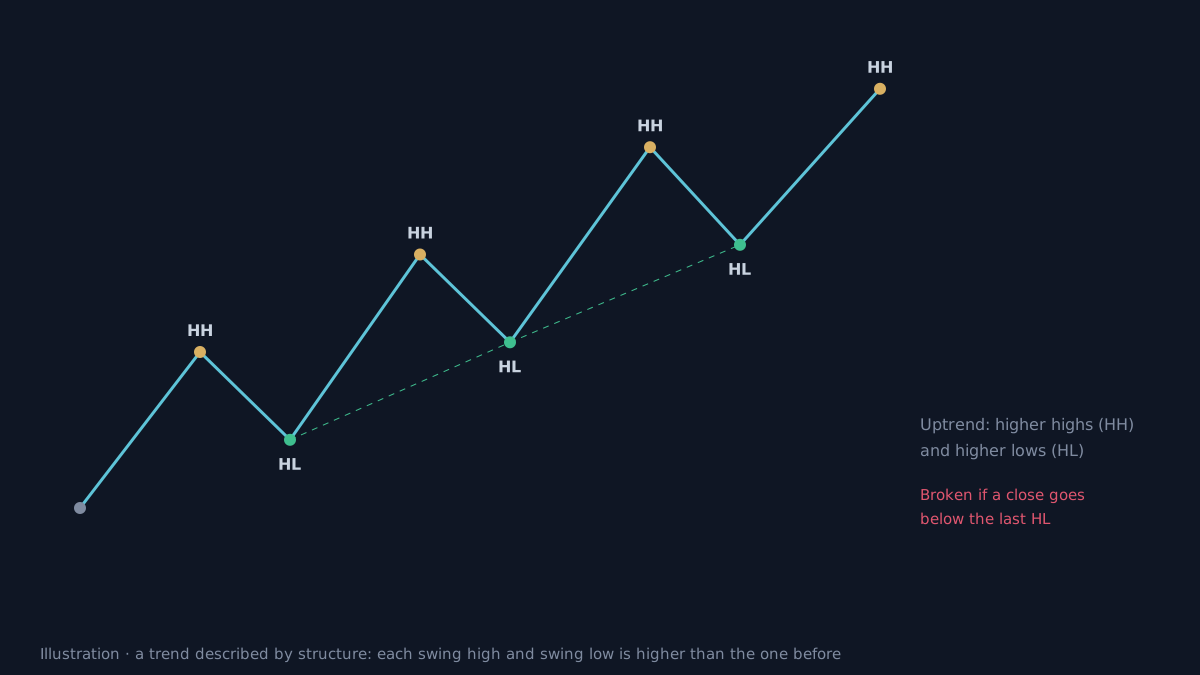
What is a trend?
A trend is price's dominant direction on a given timeframe, usually described by a sequence of rising highs and lows (up) or falling highs and lows (down).
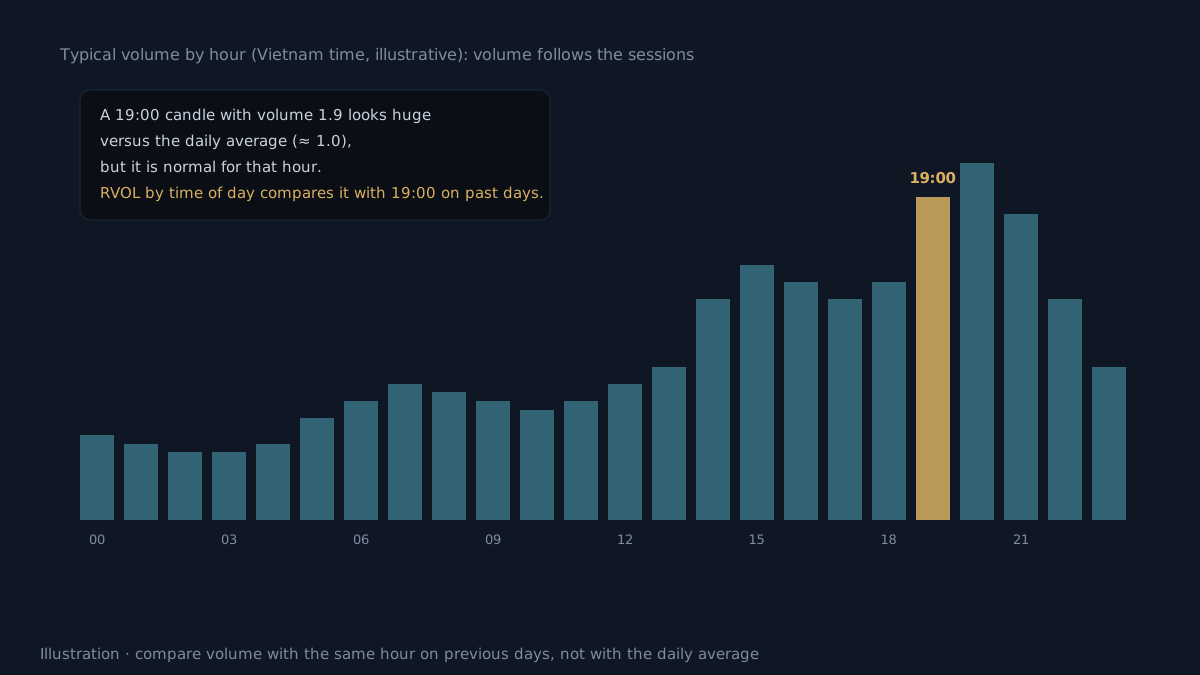
What does volume tell you, and what does it not?
Volume shows how much participation a candle had; it is useful when compared with the normal level for that hour, but it does not by itself say whether buyers or sellers won.
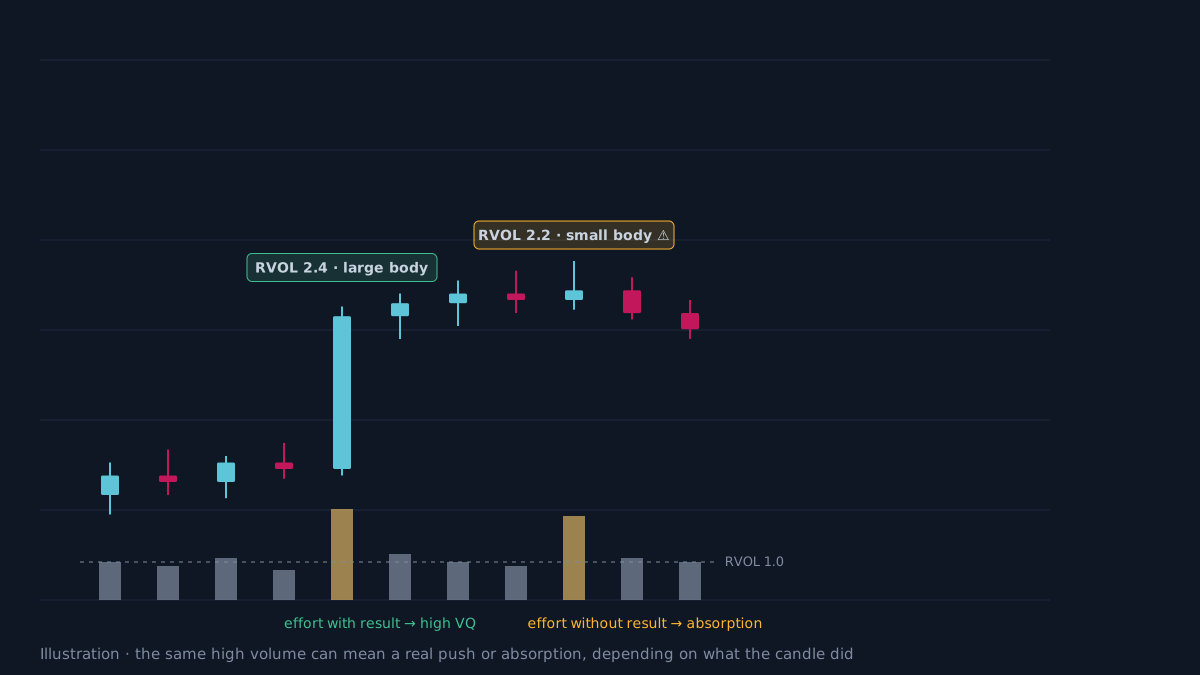
Volume Quality: when is high volume a good sign?
Volume Quality scores 0–100 whether a candle's volume really supports the trade direction, from RVOL, Delta direction, effort versus result, and volume expansion.
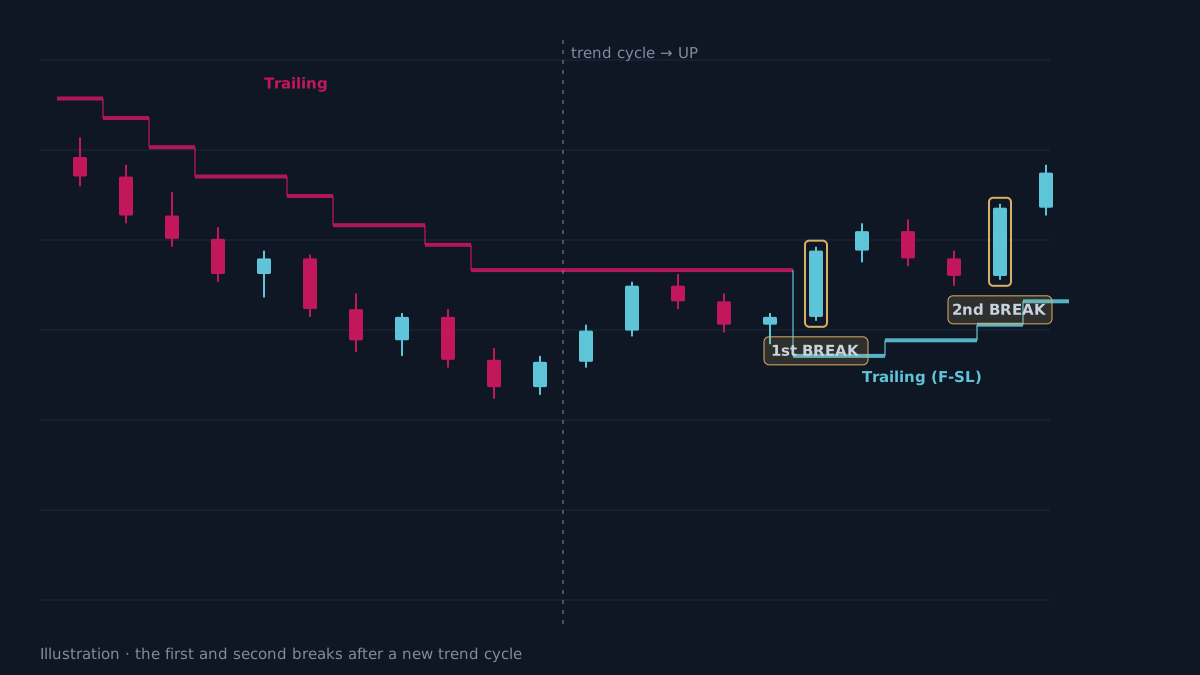
What is the 1st BREAK?
The 1st BREAK is the first time price breaks back through the Trailing line in the direction of a newly confirmed trend cycle, with a clear stop from the start.
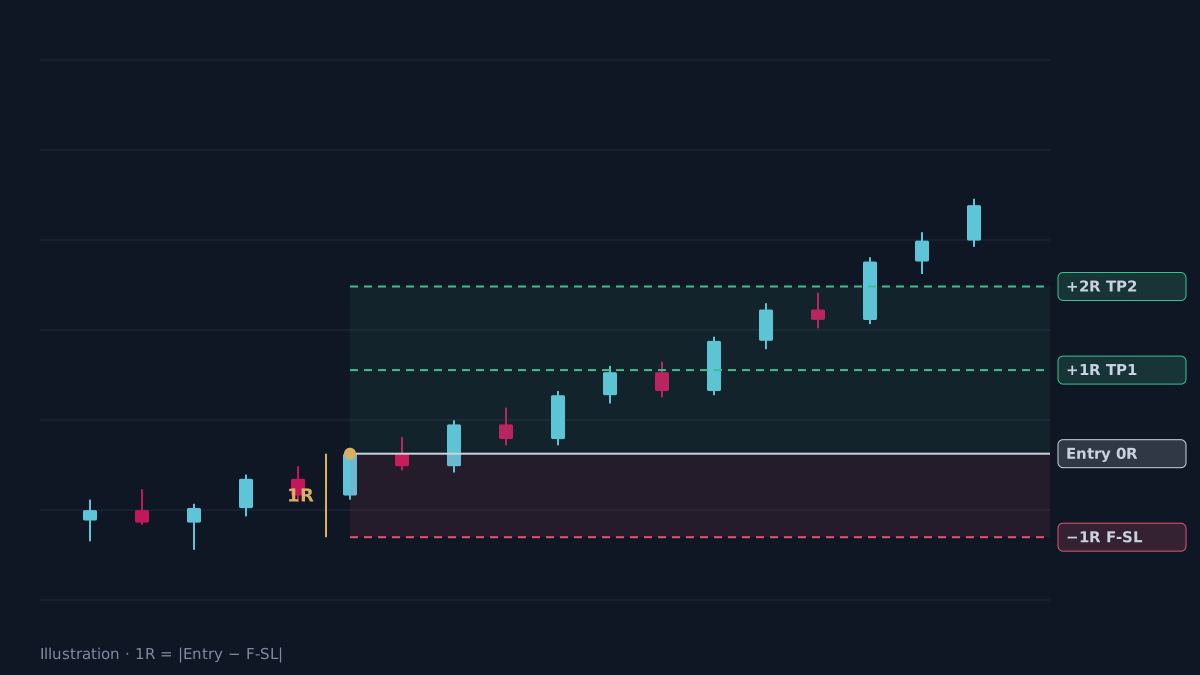
What is R-Multiple?
R-Multiple measures each trade as a multiple of its initial risk, so every trade sits on the same scale.
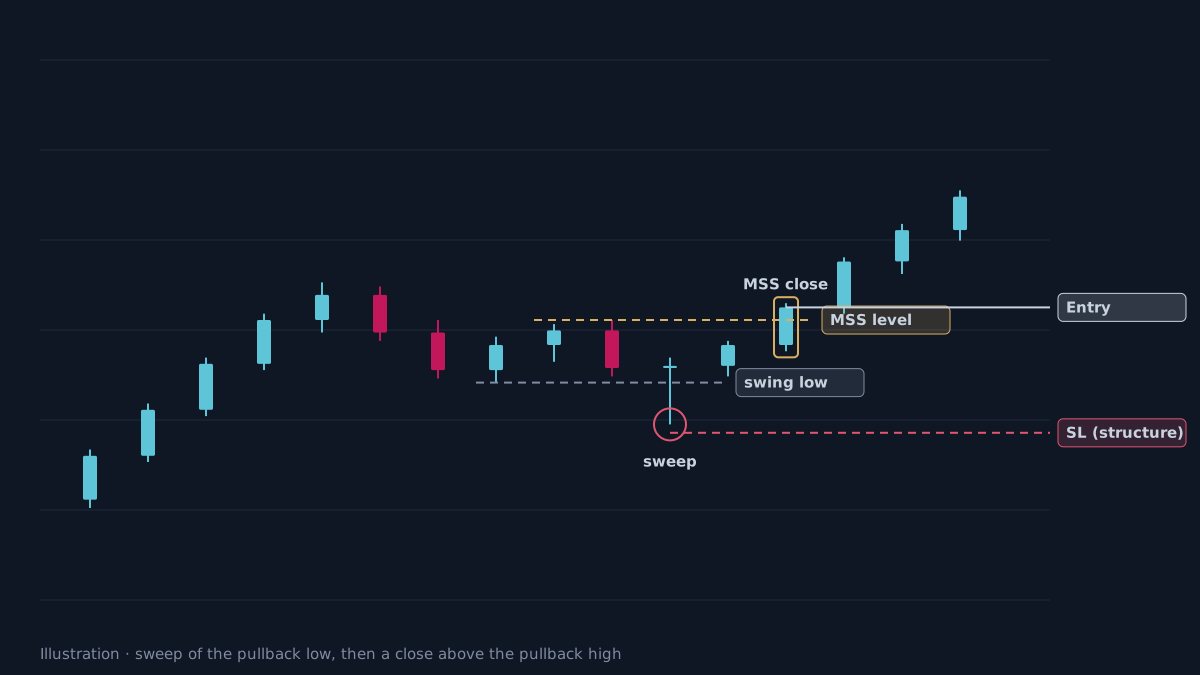
What is an SMC Sweep + MSS?
A Sweep + MSS is when price sweeps the low (or high) of a pullback and then closes beyond the latest pullback high (or low), showing momentum has returned with the main trend.