The question
H1 says buy while D1 is falling hard: which timeframe should you trust?
After this lesson you will
- Choose a sensible context timeframe and trading timeframe
- Understand why higher timeframes deserve more weight
- Avoid using unfinished higher-timeframe bars when studying the past
What is multi-timeframe analysis?
The same market tells a different story on each timeframe. Multi-timeframe analysis splits the job in two:
- The context timeframe (higher): where is the main trend going? Should you favour buying or selling?
- The trading timeframe (where you enter): where to enter, where to put the stop?
A common rule of thumb: the context timeframe is about 4–6 times the trading timeframe, for example H1 for M15, H4 for H1, D1 for H4.
Why does it matter?
- Avoid buying into a big downtrend. An H1 buy while D1 falls hard is often just a bounce.
- Higher-timeframe trends are more durable. A D1 candle contains many hours of trading, so short-term noise rarely flips it.
- Combine precision with context. The low timeframe gives the entry and a close stop; the high timeframe gives the direction.
Common misunderstandings
- More timeframes is better. Watching too many leads to conflict and no decision.
- Every timeframe counts equally. M5 agreement means much less than D1 agreement.
- Lower timeframes give context. Timeframes below your trading timeframe are just noise inside the candle you are watching.
- Using the live higher-timeframe bar to test the past. This is the most common look-ahead mistake in backtesting.
Chart example
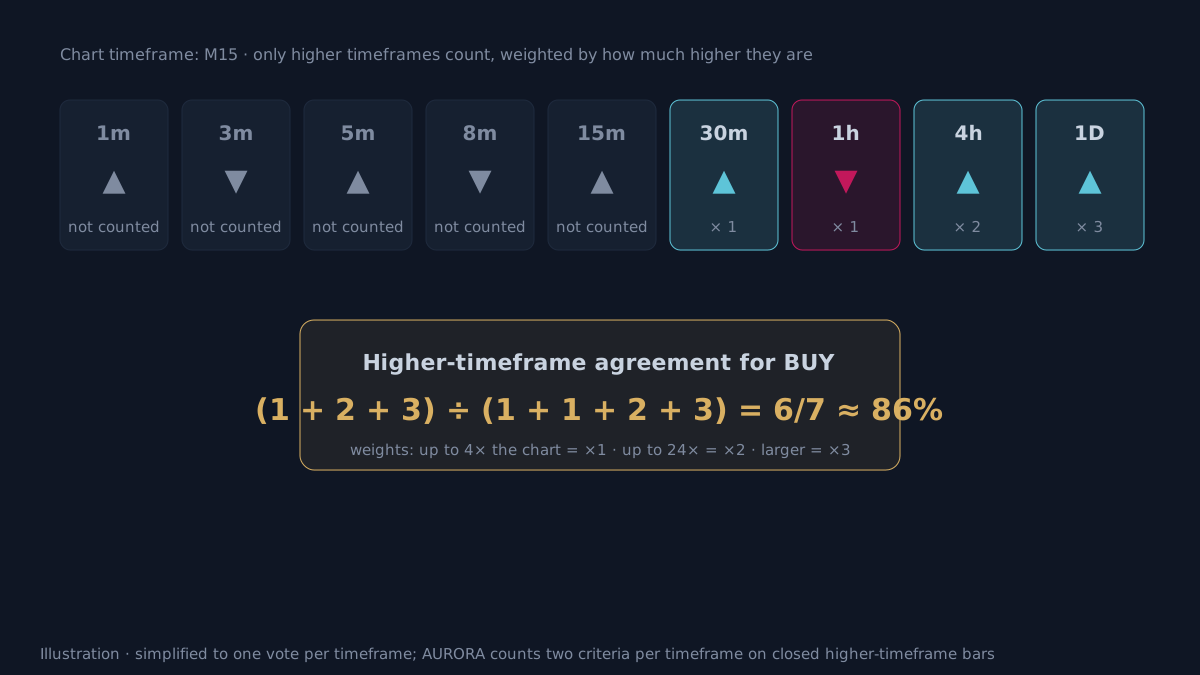 Illustration, simplified to one vote per timeframe.
How does AURORA measure timeframe agreement?
- Nine default timeframes: 1m, 3m, 5m, 8m, 15m, 30m, 1h, 4h, 1D (editable in the Extra Timeframes group).
- Two criteria per timeframe: the direction of the Kenvin cloud and of the main trend.
- Default mode Higher TFs (weighted):
- Only timeframes above the chart count.
- Up to 4× the chart: weight ×1; up to 24×: ×2; larger: ×3.
- The legacy All 9 TFs mode counts all nine equally.
- Only closed higher-timeframe bars are used, so past results do not use future information.
- Display:
- The dashboard has an
MTF (HTF)row with the buy / sell agreement percentage. - The Full layout adds the 9-timeframe table, with uncounted timeframes dimmed.
- The LIVE panel (Mini) shows
HTF %.
- The dashboard has an
- In the Score: timeframe agreement is part of the Trend family.
Limits of multi-timeframe analysis
- Lag: higher timeframes turn slowly; by the time they confirm a reversal, price may have moved far.
- Conflict is normal: during a pullback, the lower timeframe runs against the higher one for a while.
- The 4–6× ratio is a rule of thumb. Test it on the market and timeframe you trade.
Practical checklist
- Pick a context timeframe about 4–6 times your trading timeframe.
- Prefer trading in the context timeframe's direction.
- Use the trading timeframe to choose the entry and place the stop.
- When higher and lower timeframes conflict, trade smaller or stand aside.
- Use only closed higher-timeframe bars when judging context.
Video Explainer
The video for this article is in production. The full written lesson is already complete.
Video chapters
- H1 buys, D1 falls
- Context and trading timeframes
- Weighting by timeframe size
- Timeframe agreement in AURORA
- The look-ahead trap
Show transcript
H1 gives a buy signal, but D1 is falling hard. The H1 signal may just be a bounce inside a larger downtrend.
Multi-timeframe analysis splits two questions: the higher timeframe gives context, whether to favour buying or selling; the trading timeframe gives the timing and the stop placement.
The higher the timeframe, the more durable its trend, so it deserves more weight. AURORA counts only timeframes above the chart, and those far above get a higher weight.
One important note: only use closed higher-timeframe bars. Using an unfinished bar when studying a past chart quietly lets you see the future.
Product documentation
Educational and decision-support content, not investment advice. Chart examples are illustrative or historical and do not guarantee future results. Trading carries a risk of capital loss.