Is a 10-point stop far or near? Is the answer the same for gold today and gold last year?
After this lesson you will
- Calculate a candle's True Range, including when there is a gap
- Understand what ATR measures and what it does not
- Use ATR to express stop distances and candle sizes
What is ATR?
ATR (Average True Range), introduced by J. Welles Wilder, measures a market’s volatility.
Step 1, a candle’s True Range: take the largest of three numbers:
- High − Low.
- |High − Previous close|.
- |Low − Previous close|.
The last two make True Range include gaps: when price opens far from the previous candle, the real range is larger than the range visible in the candle itself.
Step 2, ATR: the average True Range over the last N bars, usually N = 14. Wilder used his own smoothing method, but the meaning is the same: “how much the market moves per bar on average”.
Why does ATR matter?
- Knowing whether a distance is far or near. A 10-point stop can be 0.5 ATR today but 2 ATR in a quiet market.
- Comparing markets. “1.5 ATR” means the same thing on gold, NAS100 or EURUSD; “10 points” does not.
- Adjusting size. When ATR rises, a sensible stop is farther away, so size must shrink to keep the money at risk constant.
Common misunderstandings
- High ATR is a buy / sell signal. ATR has no direction. It only tells you whether swings are large or small.
- Daily ATR applies to M15. ATR depends on the timeframe; check it on the one you trade.
- A 1-ATR stop is the standard. No number is right for every strategy; ATR is only a unit of measure.
- ATR forecasts future volatility. ATR describes the recent past; major news can change volatility instantly.
Chart example
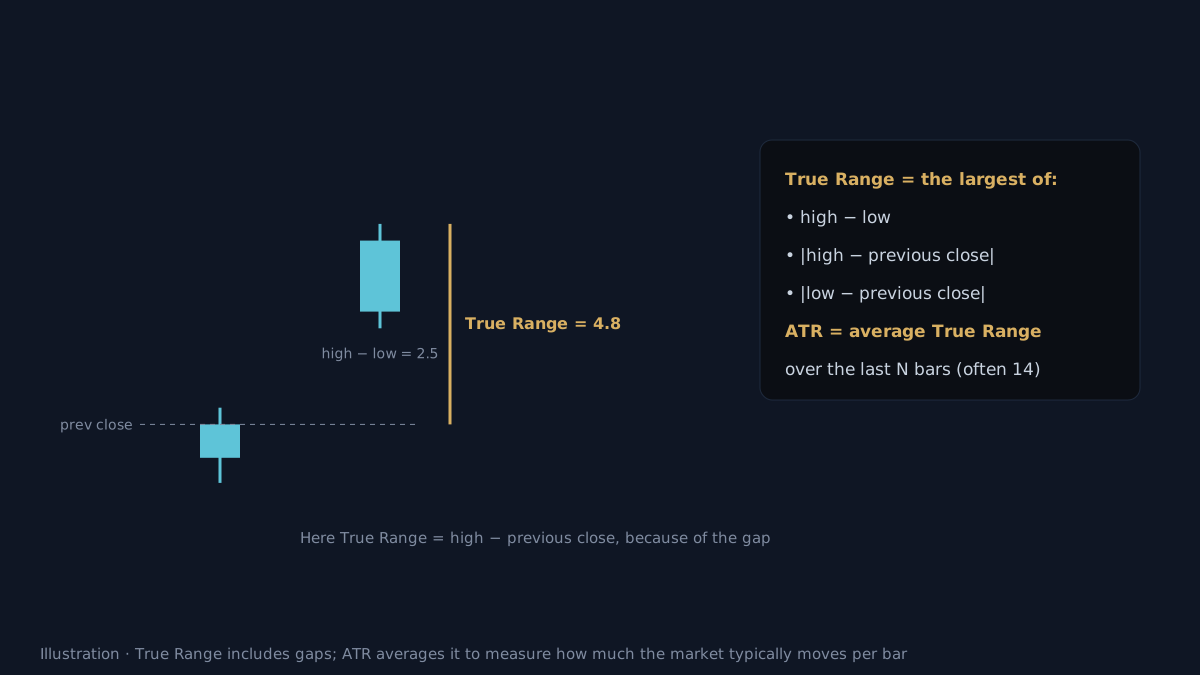 Illustration. The second candle’s high − low is only 2.5, but because of the gap its True Range is 4.8.
How does AURORA use ATR?
ATR is the unit of measure throughout AURORA:
- The Trailing line: sits a multiple of ATR from its pivot anchor, so it adapts to volatility.
- Pullback Entry: used only when the Break candle is 1.8 ATR or longer.
- Stop limits:
- AURORA Pro, Entry Filter Profile Balanced / Strict: Break stop at most 4 / 3 ATR.
- SMC: structural stop at least 0.3 ATR, with a
⚠SLwarning above 4 ATR.
- Warning colour: the Trailing line shifts gradually to orange as price comes within about 0.5–3 ATR.
- Scoring: many Score and Setup Quality components measure candle size and price stretch in ATR.
What ATR does not tell you
- Direction. Strong rallies and strong sell-offs both have high ATR.
- Upcoming volatility. News, sessions and holidays change volatility suddenly.
- The optimal distance. Which ATR multiple suits your strategy must be tested on your own data.
Practical checklist
- Check ATR on the exact timeframe you trade.
- Express stop distances in ATR to compare markets.
- Avoid stops smaller than about half an ATR: noise tags them easily.
- When ATR jumps, reduce size to keep the money at risk constant.
- Remember ATR says nothing about direction.
Video Explainer
The video for this article is in production. The full written lesson is already complete.
Video chapters
- Is 10 points far or near?
- True Range and gaps
- ATR averages True Range
- ATR in AURORA
- What ATR does not tell you
Show transcript
Product documentation
Educational and decision-support content, not investment advice. Chart examples are illustrative or historical and do not guarantee future results. Trading carries a risk of capital loss.