Both trades were 0.1 lot: why did one lose 30 USD and the other 300 USD at the stop?
After this lesson you will
- Apply the formula size = money at risk ÷ (stop distance × value per point)
- Size trades for gold, EURUSD and Vietnamese stocks
- Understand why leverage does not change risk when size is correct
What is position sizing?
Position sizing decides how much to trade so that if the stop is hit, you lose exactly the amount you planned:
Size = Money at risk ÷ (Stop distance × Value per point)
- Money at risk = equity × risk per trade. This is 1R in money.
- Stop distance = |Entry − Stop|.
- Value per point = the profit / loss when price moves 1 unit, for 1 unit of size (1 lot, 1 contract, 1 share).
Worked examples
| Market | Money at risk | Stop distance | Value per point | Size |
|---|---|---|---|---|
| Gold (XAUUSD) | 100 USD (1% of 10,000) | 12 USD | 100 USD per lot per 1 USD (100-ounce lot) | 100 ÷ 1,200 = 0.083 → 0.08 lot |
| EURUSD | 100 USD | 25 pips | 10 USD per pip per standard lot | 100 ÷ 250 = 0.4 lot |
| Vietnamese stock | 1,000,000 ₫ (1% of 100 million) | 25,000 − 23,500 = 1,500 ₫ | 1 ₫ per share | 666 → 600 shares (lots of 100) |
Value per point can differ between brokers (gold lot size, account currency). Check the contract specifications on your platform.
Why not trade a fixed size?
- Risk changes with the stop. The same 0.1 lot of gold loses 30 USD with a 3-USD stop and 300 USD with a 30-USD stop.
- Statistics in R only make sense this way. When every loss costs exactly 1R, trade results are comparable.
- Losing streaks stay under control. At 1% risk per trade, 10 losses in a row cut equity by about 9.6%, not half the account.
Common mistakes
- Choosing the size first and then a stop that “fits”. The stop is no longer an invalidation level.
- Rounding up. Always round down to the lot step; rounding up means more risk than planned.
- Thinking leverage raises risk. Leverage only reduces the margin you use. Risk is set by size and stop. What you must check is that the liquidation price sits beyond the stop.
- Forgetting costs and slippage. With tight stops, costs push the real loss above 1R.
Chart example
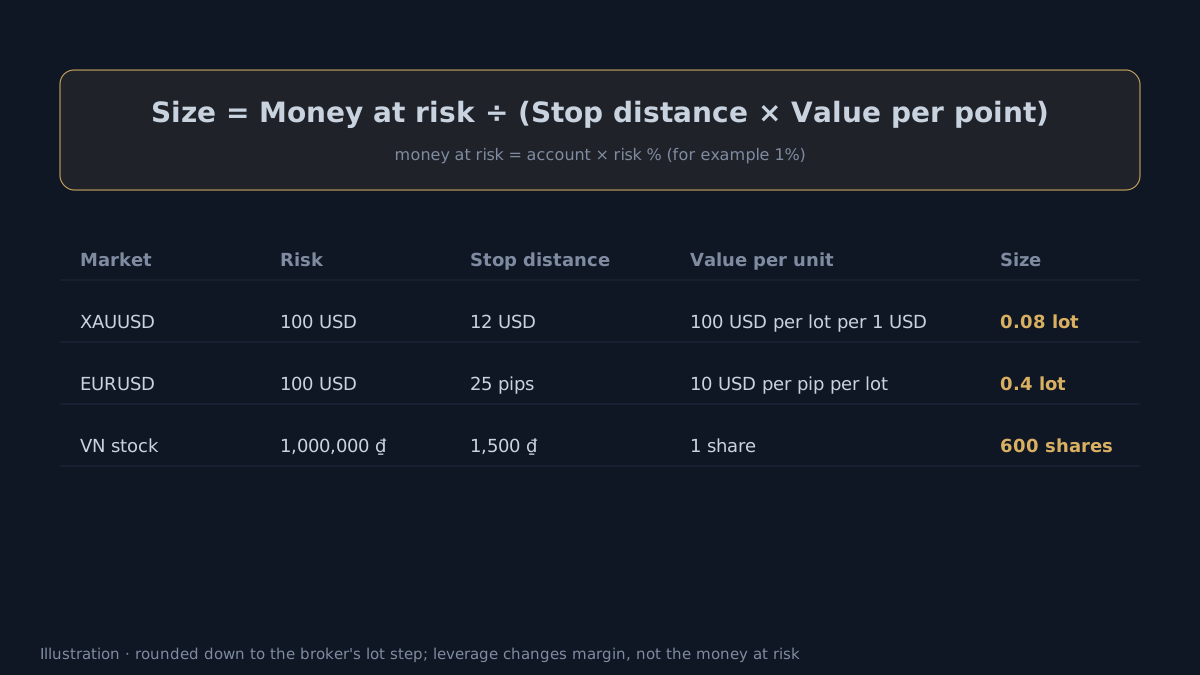 Illustration.
How does AURORA help with sizing?
- The trade plan gives the stop distance: the F-SL label shows the price and the % distance from entry; the trade detail card shows Entry, F-SL, TP1, TP2.
- The
🛡 T-SLlabel on the right edge shows the % risk of entering at the current price. - The Strategy Validator sizes trades as % of equity at risk (1% by default), with lot-step rounding and a leverage cap. It is the closest view of real trading.
- When the stop is wide (for example an SMC
⚠SLlabel), size must shrink accordingly.
AURORA does not place orders or size trades in your account; the final number depends on your broker’s contract specifications.
Limits
- Gaps and slippage can push the loss beyond 1R.
- Minimum size. With a small account or a very wide stop, the correct size may be below the broker’s minimum; then skip the trade.
- What risk % is sensible depends on your strategy and the drawdown you can tolerate; see the Drawdown article.
Practical checklist
- Choose your risk per trade first (often 0.5–1% of equity) and keep it fixed.
- Set the stop first, then calculate the size.
- Know the value per point (pip, USD, share) of what you trade.
- Round size down to the broker's lot step, never up.
- Check that the liquidation price (with leverage) sits beyond the stop.
Video Explainer
The video for this article is in production. The full written lesson is already complete.
Video chapters
- Same 0.1 lot, different losses
- The sizing formula
- Examples: gold, EURUSD, stocks
- Leverage and risk
- Common mistakes
Show transcript
Product documentation
Educational and decision-support content, not investment advice. Chart examples are illustrative or historical and do not guarantee future results. Trading carries a risk of capital loss.