Why can two trades that both made 200 USD be one good trade and one bad trade?
After this lesson you will
- Understand what 1R is and calculate it for a trade
- See why measuring results in USD alone is misleading
- Read +1.5R, +0.5R and −1R results of a partial take-profit plan
What is R-Multiple?
1R is the money you lose if the trade hits its stop loss. It is decided before entry from two numbers: the distance from entry to stop, and the position size.
A trade’s R-Multiple is its result divided by 1R.
| Case | Initial risk (1R) | Result | R-Multiple |
|---|---|---|---|
| Trade A | 100 USD | +200 USD | +2R |
| Trade B | 1,000 USD | +200 USD | +0.2R |
| Trade C | 100 USD | −100 USD | −1R |
Trades A and B made the same money, but A returned twice what it put at risk while B returned a fifth of it. R shows what the money figure hides.
Why is R better than measuring only in money?
- Trades of different size become comparable. A small and a large trade sit on the same scale.
- Markets become comparable. 50 points on gold and 50 pips on EURUSD are different things; +1R is the same thing.
- The decision is separated from the size. A system has an edge when its average R per trade is positive over enough trades, whatever size you trade.
- It is the basis of position sizing. Once you know how much 1R is worth to you, the size follows from the distance to the stop.
Where do traders get R wrong?
- Setting the stop after entry. 1R is no longer decided in advance, and every later measurement drifts.
- Widening the stop when price moves against you. The loss is now bigger than the original 1R, but the journal still says −1R.
- Looking only at win rate. Winning 70% with an average win of +0.3R and losses of −1R is still a losing system: 0.7 × 0.3 − 0.3 × 1 = −0.09R per trade.
- Ignoring commission and slippage. With a very tight stop, costs can be a large share of 1R.
Chart example
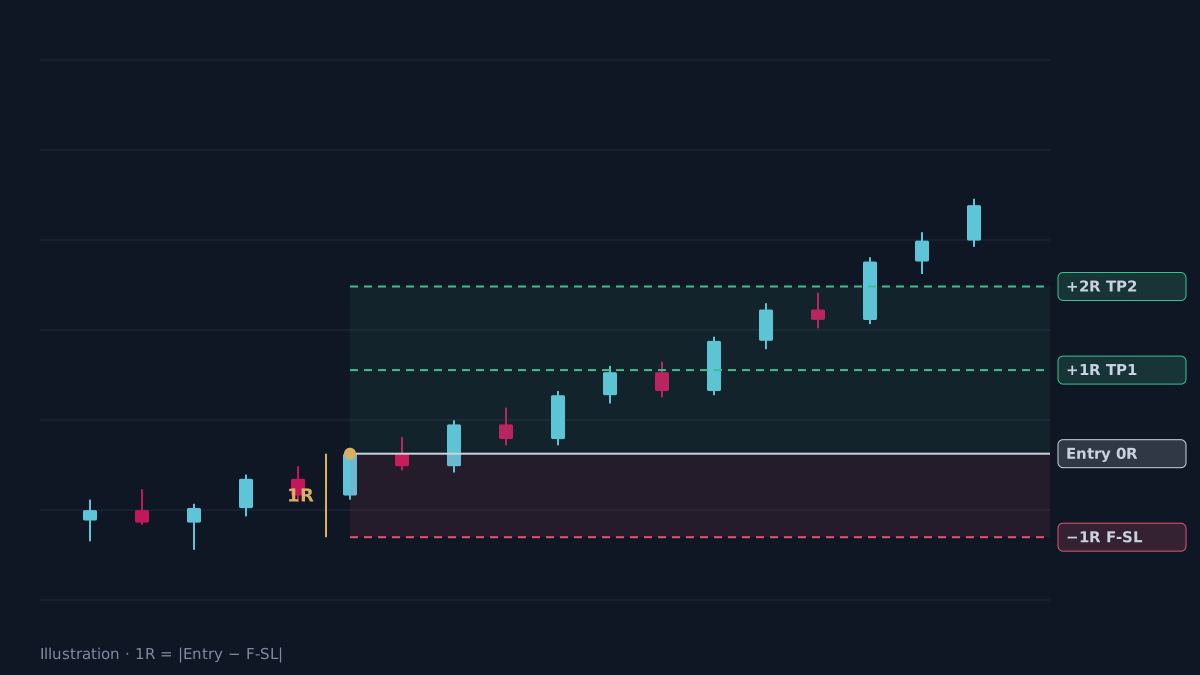 Illustration, not real market data.
A common partial take-profit plan: close half the position at TP1 (+1R) and half at TP2 (+2R).
| What happens | Calculation | Result |
|---|---|---|
| TP1, then TP2 | 0.5 × 1R + 0.5 × 2R | +1.5R |
| TP1, rest stopped at breakeven | 0.5 × 1R + 0.5 × 0R | +0.5R |
| Stop before TP1 | 1 × (−1R) | −1R |
How does AURORA use R?
AURORA draws a trade plan for every signal. The F-SL, the fixed stop set at the signal candle, defines 1R; TP1 defaults to 1R and TP2 to 2R. When a trade closes, the result label is written in R, for example ✓ +1.5R · TP2 or ✗ −1R · SL, and the dashboard adds up total R and average R per trade for each setup.
AURORA’s Strategy Validator sizes positions as a percentage of equity at risk, so Strategy Tester results follow the same logic.
You do not need AURORA to use R: a spreadsheet with entry, stop, size and result is enough.
When does R mislead?
- Gaps and slippage. When price jumps through the stop, the real loss can exceed 1R. Record planned R and realised R separately.
- Very tight stops. A tiny 1R makes results in R look large, but costs measured in R grow just as much.
- Small samples. The average R of ten trades says little; you need more trades and an out-of-sample check.
- Different holding times. Two systems at +0.3R per trade, one holding ten times longer, use capital very differently.
Practical checklist
- Set the stop before you enter, not after.
- Calculate 1R in money: entry-to-stop distance times position size.
- Record every trade in R, not only in money.
- Never widen the stop after entry: it changes 1R.
- Judge a system by average R per trade over enough trades, after costs.
Video Explainer
The video for this article is in production. The full written lesson is already complete.
Video chapters
- Two trades, both up 200 USD
- Defining 1R
- Reading +1.5R, +0.5R, −1R
- R on the AURORA dashboard
- When R misleads
Show transcript
Product documentation
Educational and decision-support content, not investment advice. Chart examples are illustrative or historical and do not guarantee future results. Trading carries a risk of capital loss.