A configuration looks great over the whole history: is it great because of an edge, or because it was tuned to that very history?
After this lesson you will
- Split data into a tuning period and a testing period
- Understand why the out-of-sample period can only be used once
- Run the split with AURORA's Strategy Validator
What are in-sample and out-of-sample?
- In-sample (IS): the data used to choose and tune settings.
- Out-of-sample (OOS): data set aside, never looked at while tuning, used only to test the chosen settings.
A simple split: roughly the first two thirds of the data in-sample, the last third out-of-sample. The out-of-sample period should be the more recent one, as it is the closest thing to “the future”.
Walk-forward testing repeats this many times: choose settings on one window, test on the next, then roll forward through time.
Why split the data?
- Any configuration can look good on the data used to choose it. That is the nature of optimisation.
- Out-of-sample measures generalisation. If a configuration only shines in-sample, it has likely learned random noise too (overfitting).
- More realistic expectations. Out-of-sample results are usually closer to live trading than in-sample results.
Mistakes that spoil the out-of-sample period
- Looking at OOS results and then tuning again. The OOS period has now become in-sample.
- Trying many configurations on OOS and keeping the best. That is also optimising on OOS.
- An out-of-sample period that is too short. A few dozen trades are not enough to conclude.
- Choosing an “easy” out-of-sample period. For example only a strongly trending stretch; let time set the boundary.
Chart example
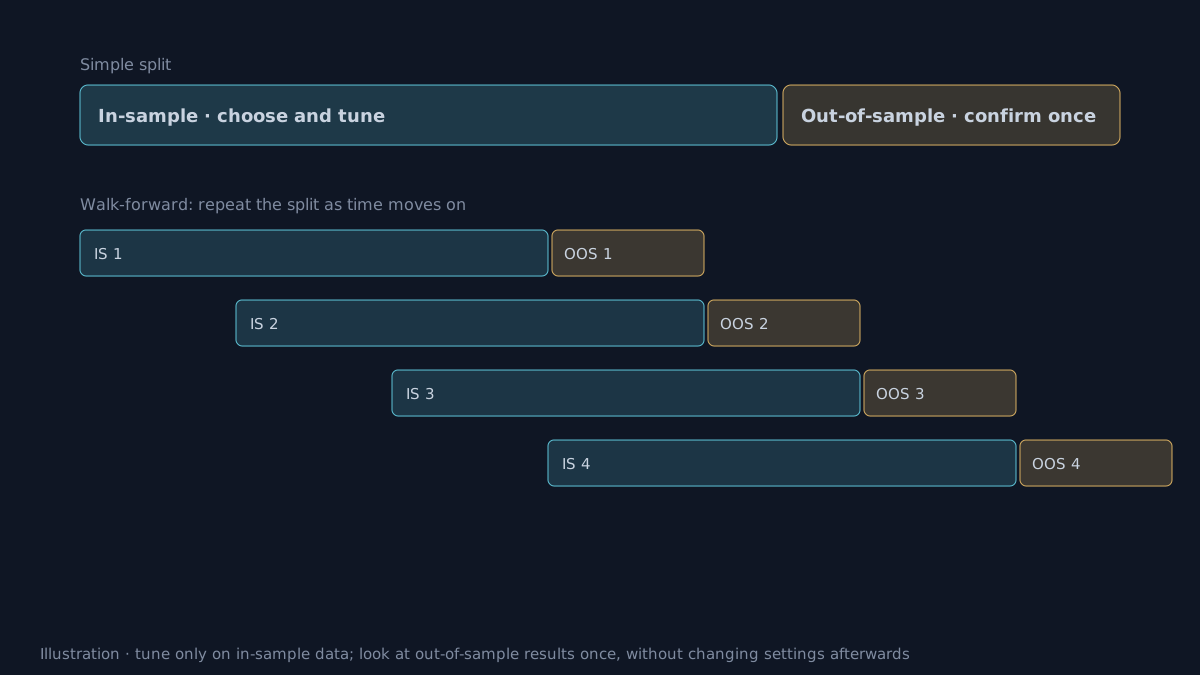 Illustration.
How do you do it with AURORA’s Strategy Validator?
- Give the Validator the same settings as the indicator, with commission and slippage matching your broker.
- Set the in-sample range in the Backtest từ ngày / đến ngày (from / to date) boxes and choose
ISin Sample tag. Tune within this range. - Freeze the settings, switch the dates to the remaining period and choose
OOS. Record the result once. - Trades still open at the end of the range close with a
WINDOWlabel; trade names carryISorOOSso you can filter them when exporting the trade list. - Compare average R, Profit Factor, maximum drawdown and trade count between the two periods.
Reading the result: out-of-sample slightly weaker is normal. Out-of-sample negative while in-sample looks great is a sign the configuration is not trustworthy.
Limits
- Markets change. A good out-of-sample period does not guarantee the next one.
- Data is limited. Splitting leaves less data in each part; on high timeframes there may not be enough trades.
- Past results do not guarantee the future, out-of-sample results included.
Practical checklist
- Split the data before you start tuning.
- Tune settings only on the in-sample period.
- Look at out-of-sample results once, and do not go back to tune further.
- Accept that out-of-sample results are usually weaker than in-sample.
- Make sure the out-of-sample period is long enough to contain enough trades.
Video Explainer
The video for this article is in production. The full written lesson is already complete.
Video chapters
- Edge, or fitted to history?
- Split the data in two
- Walk-forward
- Doing it with the Strategy Validator
- Mistakes that spoil out-of-sample
Show transcript
Product documentation
Educational and decision-support content, not investment advice. Chart examples are illustrative or historical and do not guarantee future results. Trading carries a risk of capital loss.