Tuning parameters until the backtest is as good as possible: is that finding an edge, or framing luck?
After this lesson you will
- Recognise the signs of an overfitted configuration
- Understand why more parameters and filters increase the risk
- Choose settings from a stable region rather than the single best point
What is overfitting?
Price data has two parts: repeating patterns (if any) and random noise. When you tune parameters for the best backtest, you fit not only the repeating part but the noise too.
Overfitting is when the noise-fitting dominates: the settings look excellent on past data, but the noise does not repeat, so results on new data are much worse.
Warning signs
- Out-of-sample collapse. Out-of-sample results are negative while in-sample results look great.
- Spikes. Only one parameter value works well; its neighbours do poorly.
- Too many specific filters. For example “buy only on Tuesdays, after 10 am, when RSI is between 53 and 57”.
- Results too good on short data. A very high Profit Factor, unusually long winning streaks.
- Many combinations tried. The more you try, the more likely one looks great by chance.
Why does it matter?
- You trade the future, not the past. An overfitted configuration gives wrong expectations of profit and risk.
- Every parameter is a chance to fit noise. Adding parameters and filters always improves a backtest, even when no real edge is added.
- Hidden costs. Overfitted systems often have few trades, making statistics less reliable (see Sample size).
Chart example
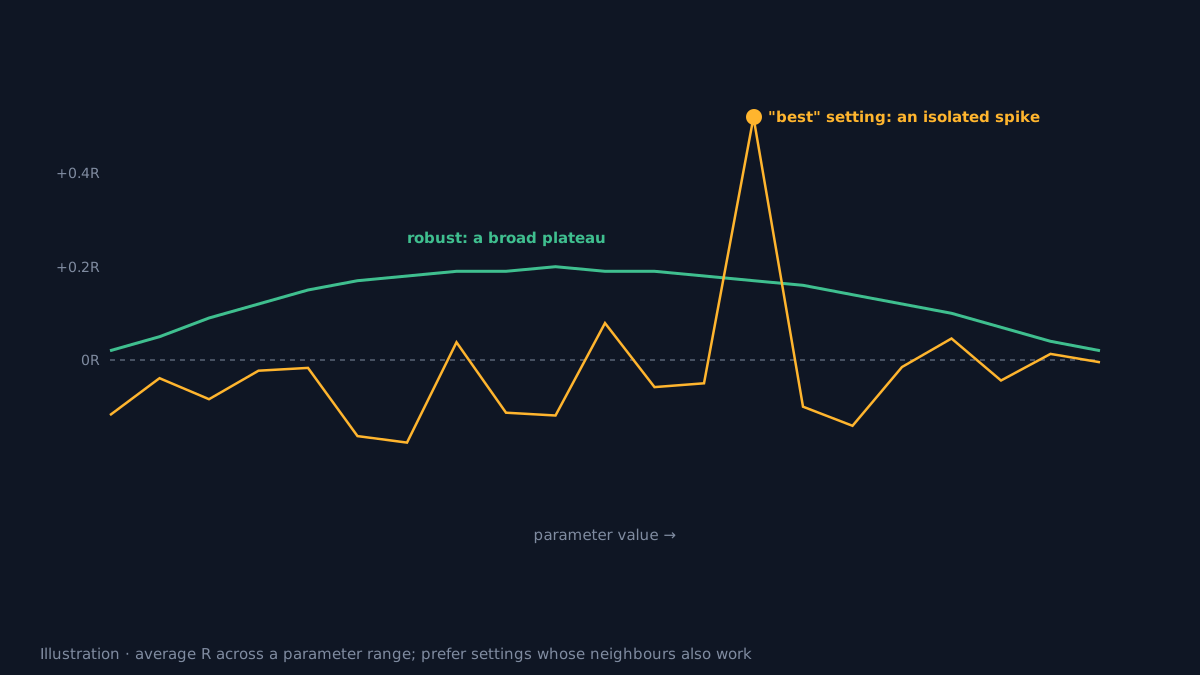 Illustration with hand-built values.
Green line: good results across a broad range of parameter values. Picking the middle of that range is safer. Orange line: only one point spikes; it is very likely luck.
How does AURORA limit overfitting?
AURORA’s design deliberately reduces chances to overfit:
- Quality layers default to “Stats only”. Setup Quality, Tier 3 and SMC Quality only score and record, never filter on their own. Switch on Filter only after validation.
- The Entry Filter Profile is separate from the Trading Style, so you change one factor at a time.
- Core parity as a baseline, close to AURORA Standard, before trying stricter profiles.
- The ⛔ Filtered row measures what a filter is really worth, instead of only looking at results after filtering.
- The Strategy Validator has date ranges and IS / OOS tags for out-of-sample checks.
Even so, AURORA has many settings. Tuning all of them to fit one symbol over one period is still overfitting; no tool replaces the discipline of validation.
How to avoid it
- Few parameters, few filters. Add one only with a clear, testable reason.
- Choose a stable region, not the single best point.
- Test out-of-sample, across several similar symbols.
- Discount the best result by the number of attempts: after trying 100 combinations, the best one almost certainly looks better than reality.
Practical checklist
- Prefer settings whose neighbouring values also perform well.
- Limit how many parameters and filters you tune.
- Test out-of-sample and across several symbols.
- Be suspicious of results that look too good on short data.
- Record how many variants you tried: the more you try, the more the best result must be discounted.
Video Explainer
The video for this article is in production. The full written lesson is already complete.
Video chapters
- Finding an edge or framing luck
- What overfitting is
- Warning signs
- Plateaus and spikes
- How AURORA limits overfitting
Show transcript
Product documentation
Educational and decision-support content, not investment advice. Chart examples are illustrative or historical and do not guarantee future results. Trading carries a risk of capital loss.