A Profit Factor of 2.0 over 15 trades or 1.3 over 400 trades: which is more trustworthy?
After this lesson you will
- Calculate Profit Factor from gross profit and gross loss
- Understand how Profit Factor relates to win rate and average R
- Know why Profit Factor on small samples misleads
What is Profit Factor?
Profit Factor = Gross profit of winning trades ÷ Gross loss of losing trades
- Above 1: profitable on the tested data.
- Equal to 1: breakeven.
- Below 1: losing.
Profit Factor is closely related to expectancy: both combine win rate with the size of wins and losses. The difference is that Profit Factor is a ratio, while expectancy is a difference in R per trade.
Example
Hypothetical system: 40% of trades +1.5R, 15% 0R, 45% −1R.
| Before costs | After 0.1R cost per trade | |
|---|---|---|
| Gross profit per trade | 0.40 × 1.5 = 0.60R | 0.40 × 1.4 = 0.56R |
| Gross loss per trade | 0.45 × 1 = 0.45R | 0.45 × 1.1 + 0.15 × 0.1 = 0.51R |
| Profit Factor | 1.33 | about 1.10 |
| Expectancy | +0.15R | +0.05R |
A cost of 0.1R per trade sounds small, yet it removes two thirds of the expectancy.
Common misunderstandings
- A high Profit Factor means a good system. On small samples, a few big winners can push it very high.
- The higher it is, the more you should trust it. A suspiciously good number (say above 3) on short data is often a sign of overfitting or luck.
- Profit Factor describes risk. No. Two systems with the same Profit Factor can have very different drawdowns.
- Reading it before costs. Always compare the figure after commission and slippage.
Chart example
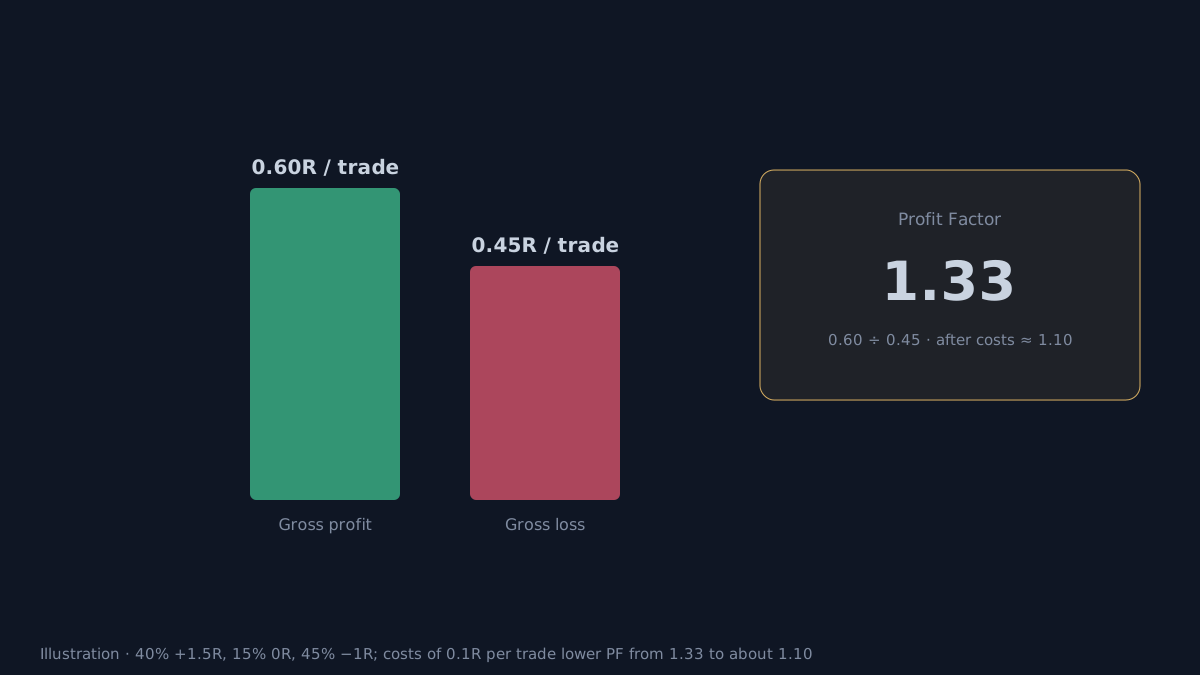 Illustration with hypothetical values.
How do you read Profit Factor with AURORA?
- The Strategy Validator (Standard and Pro) shows Profit Factor in the Strategy Tester, after the commission and slippage set in Strategy Properties.
- The chart dashboard does not show Profit Factor; it shows total and average R, before costs.
- Comparing configurations: when changing the Entry Filter Profile or a filter, compare Profit Factor, average R, maximum drawdown and trade count together. Never choose a configuration just for the highest Profit Factor.
- In-sample versus out-of-sample: a sharp drop in Profit Factor out-of-sample is a warning sign.
Limits
- Sensitive to big trades. A single very large winner can make up most of the gross profit.
- Says nothing about time. Profit Factor does not tell you how long the system took to earn it.
- Past results do not guarantee the future.
Practical checklist
- Read Profit Factor after costs, not before.
- Always state the trade count alongside Profit Factor.
- Check whether a few of the largest trades make up most of the profit.
- Read it together with maximum drawdown.
- Compare Profit Factor between in-sample and out-of-sample periods.
Video Explainer
The video for this article is in production. The full written lesson is already complete.
Video chapters
- 2.0 over 15 trades or 1.3 over 400
- The Profit Factor formula
- How it relates to average R
- How much costs lower it
- Reading it in the Strategy Validator
Show transcript
Product documentation
Educational and decision-support content, not investment advice. Chart examples are illustrative or historical and do not guarantee future results. Trading carries a risk of capital loss.