Thirty trades with an average of +0.20R: is that enough to trust the system has an edge?
After this lesson you will
- Understand why the average R of a small sample swings widely
- Estimate a confidence range for average R
- Know when to wait rather than rush to a conclusion
What is sample size, and why does it matter?
Sample size is the number of trades used to judge a system. Every trade has a different result (+1.5R, 0R, −1R…), so the average R of a small group of trades swings widely through luck alone. The larger the sample, the closer the measured average gets to the true expectancy.
The error of average R
A simple estimate:
Standard error ≈ Standard deviation of R per trade ÷ √(number of trades)
The plausible range (about 95%) of the true average R is measured average R ± 2 standard errors.
Example: a measured average of +0.20R, with a per-trade standard deviation of about 1.2R (reasonable for a +1.5R / 0R / −1R plan):
| Trades | Standard error | Plausible range of true average R | Conclusion |
|---|---|---|---|
| 30 | 0.22R | −0.23R … +0.63R | Cannot be told apart from 0 |
| 100 | 0.12R | −0.04R … +0.44R | Still touches 0 |
| 400 | 0.06R | +0.08R … +0.32R | Basis to believe it is positive |
Common misunderstandings
- 30 trades is enough. 20–30 trades is the minimum to start looking, not to conclude.
- Win rate settles quickly. Win rate swings too; 50% wins over 30 trades could be a 40% or a 60% system.
- Split the data to find a bright spot. Splitting by session, score or setup leaves each group with few trades; searching many small groups will surely find a “great” one by chance.
- Good results on one symbol are enough. Pooling several similar symbols grows the sample and reduces the risk of luck.
Chart example
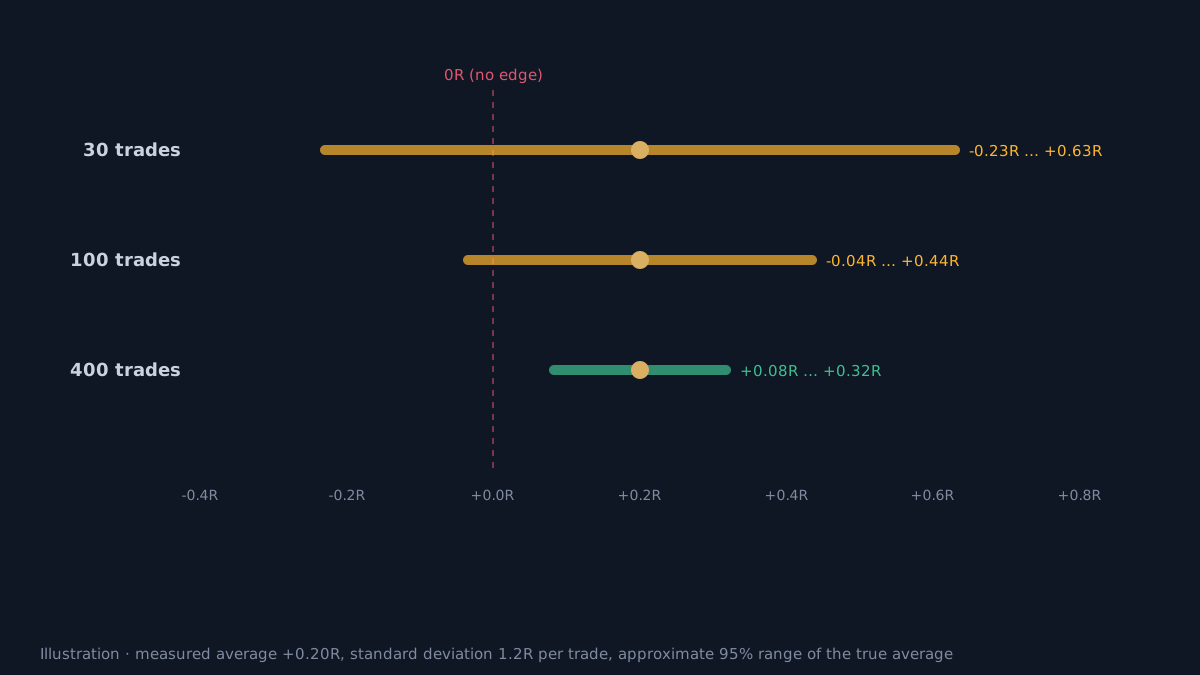 Illustration assuming an average of +0.20R and a standard deviation of 1.2R per trade.
Applying it when reading AURORA statistics
-
Always read the trade count first on the dashboard; rows with few trades are hints, not conclusions.
-
The sub-rows with the fewest trades:
- Score ≥ 70, session rows, ⛔ Filtered.
- In AURORA Pro: 💎 Sweep, RETEST / SWEEP / IFVG.
These are where false differences appear most easily.
-
Strategy Validator across symbols: export the trade lists of several similar symbols to get a bigger sample when analysing Q and T3 score buckets.
-
Combine with out-of-sample testing: choose a configuration on in-sample data and confirm it out-of-sample.
Limits
- The formula assumes independent trades and unchanging market conditions. In reality markets change regime, so even a large sample from one period may not represent the future.
- 1.2R is an example. Calculate the real standard deviation from your own trade list.
- A large sample cannot fix bad data. Costs, data sources and calculations must be right first.
Practical checklist
- Write the trade count next to every statistic.
- Treat 20–30 trades as the minimum to start looking, not to conclude.
- Estimate a range of about ±2 standard errors around average R.
- Pool data from several symbols of the same market type to grow the sample.
- The more you split groups (by session, by score), the more trades each group needs.
Video Explainer
The video for this article is in production. The full written lesson is already complete.
Video chapters
- 30 trades, +0.20R
- Small samples swing
- The standard error of average R
- Applying it to AURORA statistics
- Limits
Show transcript
Product documentation
Educational and decision-support content, not investment advice. Chart examples are illustrative or historical and do not guarantee future results. Trading carries a risk of capital loss.