The dashboard on the chart shows a profit: what is left after commission, slippage and realistic fills?
After this lesson you will
- Understand why dashboard results and Strategy Tester results differ
- Set commission, slippage, sizing and leverage to match your own account
- Use In-sample / Out-of-sample to test a configuration before risking money
What is the Strategy Validator?
The chart dashboard records trade-plan results in R, assuming entry exactly at the candle close and before costs. The Strategy Validator is AURORA’s strategy version: the same signals, run in TradingView’s Strategy Tester like a simulated account.
| Dashboard (indicator) | Strategy Validator | |
|---|---|---|
| Entry price | Signal candle close | Fills on the next tick / bar |
| Costs | Not included | Commission + slippage on every fill |
| Size | None (R only) | Percentage of equity at risk |
| Results | Total R, average R | Net profit, maximum drawdown, Profit Factor, trade list |
Why is this step needed?
- Costs hit every trade. With tight stops, commission and slippage can be a large share of 1R.
- Real fills are imperfect. Gaps and slippage push real risk away from the nominal 1R.
- Drawdown decides whether you can stay in. A profitable system with deep equity drops may be unusable on a funded account.
Common misunderstandings
- A good backtest means the strategy will make money. No. It is still a past result, even with costs.
- The default costs fit everyone. The defaults (0.05% per trade + 2 ticks of slippage) are placeholders. Stocks and crypto usually charge a percentage, futures a fee per contract, CFDs and forex mostly via the spread.
- Optimising on all history. Tuning until the whole history looks good is the fastest way to a configuration that only works in the past.
- The Validator does not need the indicator’s settings. With a different Market Preset, Trading mode or Entry Filter Profile, the Validator is testing a different system.
Chart example
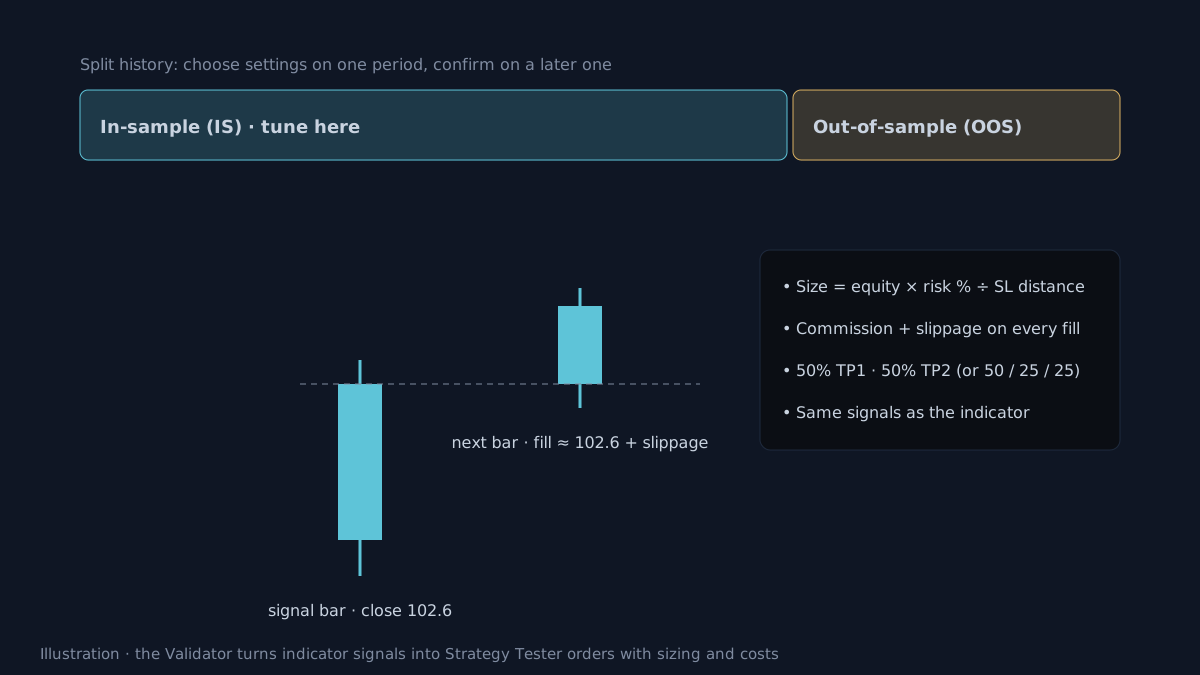 Illustration.
How do you use AURORA’s Strategy Validator?
Setup:
- Add the Validator to the same chart as the indicator, with the same Market Preset and Trading mode. In AURORA Pro, also match the Trading Style and Entry Filter Profile.
- Open Strategy Properties and replace commission and slippage with your broker’s or exchange’s figures.
- Sizing: by default 1% of equity is risked per trade, calculated from the stop distance. The Round qty to lot step box rounds to your lot size: 100 for Vietnamese stocks, 0.001 for crypto…
- Leverage: the Max position notional box (5× equity by default) must match the Margin in Strategy Properties (20% by default). For unleveraged accounts, set 1 and 100% margin.
Fill assumptions:
- Market orders fill on the next bar. Size, SL and TP are calculated from the signal candle’s close, so 1% is the target risk; real risk can differ when price gaps.
- Position split: 50% TP1 + 50% TP2. With the Runner (Pro): 50% / 25% / 25%. These orders are placed as soon as the trade opens. Very small sizes, such as 1 contract, cannot be split.
- Pullback limit orders fill according to Verify price for limit orders in Strategy Properties. Compare 0 ticks with 1 tick or more.
- The Validator sends no JSON alerts by default, because the JSON describes the indicator’s plan, not Strategy Tester fills.
Splitting periods:
- The Backtest từ ngày / đến ngày (from / to date) boxes limit when trades can open. Trades still open at the end close with a
WINDOWlabel. - The Sample tag box (IS / OOS) adds a tag to trade names.
Reading trade names in the trade list:
| Name | Meaning |
|---|---|
BREAK-L, BREAK-S |
BREAK long / short (1st and 2nd BREAK combined) |
BREAK-L·PB |
A BREAK entered with a Pullback limit order |
SUNNY-L, SMART-L |
A SUNNY trade, a Smart trade |
SMC-SWEEP-L W |
(Pro) SMC SWEEP, W when the structural stop is wide |
Q72, T65, RUN |
(Pro) Setup Quality score, Tier 3 score, Runner planned |
OOS |
A trade in the Out-of-sample period |
Exits are labelled TP1, TP2, SL, or EXIT / TIME / REV / NEXT as on the indicator.
A suggested validation routine:
- Choose the symbol and timeframe, and set realistic costs.
- Set the In-sample window, for example the first two thirds of history, and tune the configuration there.
- Freeze the configuration, switch to the remaining Out-of-sample window, and record the result.
- Change one factor at a time; compare average R, maximum drawdown, Profit Factor and trade count.
- Repeat on a few other symbols of the same market type before trusting a configuration.
Limits of the Strategy Validator
- History depth depends on your TradingView plan; less data means fewer trades and weaker conclusions.
- Simulation is not reality: variable spreads, overnight financing, bot latency and news-time liquidity are not fully modelled.
- Out-of-sample can only be used once. If you look at the OOS result and go back to tune again, that period has become in-sample.
- Past results do not guarantee the future. The Validator is a filter for removing weak configurations, not a profit forecast.
Practical checklist
- Give the Validator the same Market Preset and Trading mode (and in Pro: Trading Style, Entry Filter Profile) as the indicator.
- Replace the default commission and slippage with your broker's or exchange's figures.
- Match the Max position notional box to the Margin in Strategy Properties.
- Choose the configuration on the In-sample period, then check it on the Out-of-sample period.
- Change one factor at a time, and compare average R, drawdown and trade count.
Video Explainer
The video for this article is in production. The full written lesson is already complete.
Video chapters
- What is left after costs?
- How the Validator differs from the dashboard
- Setting it up for your account
- In-sample and out-of-sample
- A validation routine
Show transcript
Product documentation
Educational and decision-support content, not investment advice. Chart examples are illustrative or historical and do not guarantee future results. Trading carries a risk of capital loss.