Why does a stop placed just below an old low so often get tagged by a few ticks before price bounces?
After this lesson you will
- Recognise chart areas likely to hold clusters of resting orders
- Understand liquidity sweeps and why they are not always traps
- Know the limits of inferring liquidity from candlestick charts
What is liquidity on a chart?
In technical analysis, especially in Smart Money Concepts (SMC), liquidity usually refers to price areas likely to hold many resting orders:
- Below obvious lows: stops of long trades and sell-stop breakout orders.
- Above obvious highs: stops of short trades and buy-stop breakout orders.
- Equal highs and equal lows: many traders see the same level, so orders pile up there.
When price reaches these areas, the resting orders trigger. For a large player wanting to buy size, a cascade of sell stops below a low is a source of supply to fill against.
Why does it matter?
- Better stop placement. A stop right below an obvious low is easily tagged by an ordinary sweep.
- Better breakout reading. A poke through a high that closes back inside is very different from a close beyond the high that holds.
- Understanding why first breakouts often fail. This is also why AURORA tracks the 2nd BREAK separately.
Common misunderstandings
- Every wick is a stop hunt. A wick can be ordinary volatility. A sweep means something when it happens at an obvious level and the candle closes back inside.
- You can know exactly where liquidity sits. A candlestick chart does not show the order book; liquidity zones are inferred.
- A sweep is always a reversal signal. In a strong trend, price can sweep a low and keep falling. Reading sweeps in the main trend direction is safer.
- SMC is how institutions trade. SMC is a way of interpreting charts; nothing guarantees that large funds actually trade these patterns.
Chart example
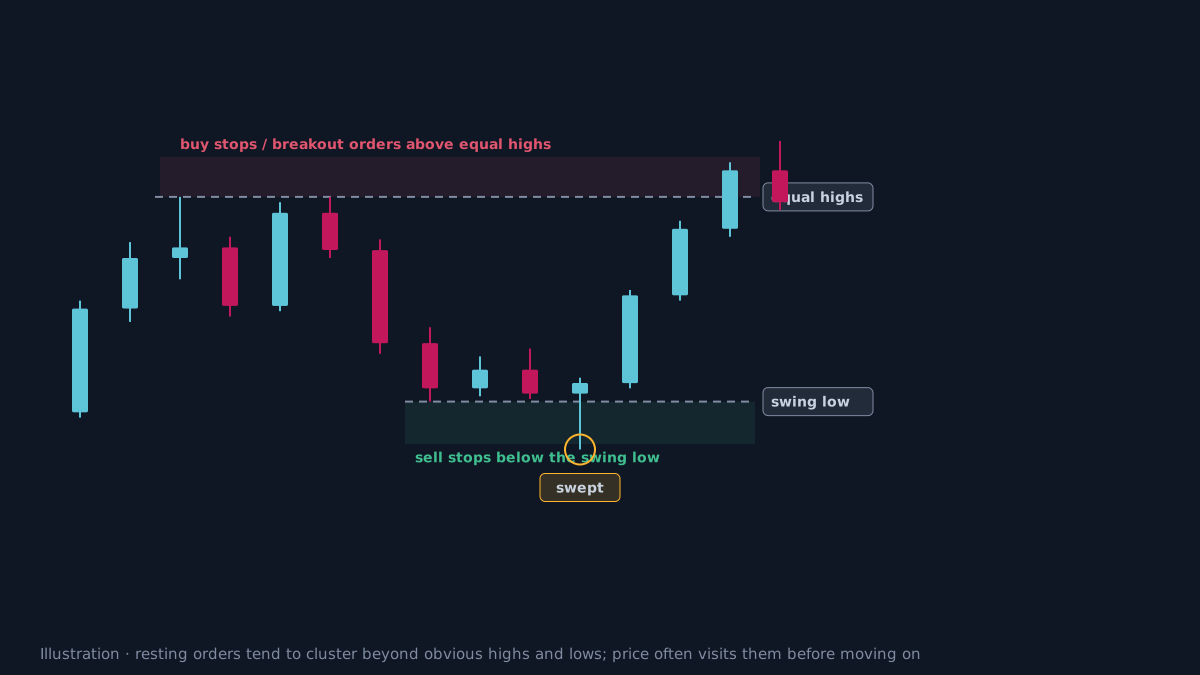 Illustration, not real market data.
How does AURORA Pro use the idea of liquidity?
AURORA Pro does not eyeball liquidity; it uses fixed rules:
- Swings are confirmed after 3 bars on each side and do not repaint.
- SMC SWEEP + MSS: a wick sweeps the pullback swing, the candle closes back inside, then a candle closes beyond the latest high (low) within 8 bars.
- Tier 3: a sweep of a recent high / low (searched over 15 bars) just before a BREAK turns the label from ⚡ to 💎.
- SMC Quality: measures the room to the opposing liquidity, the nearest unbroken swing ahead, in R. More room means a higher score.
Every liquidity-based setup in AURORA Pro trades only in the main trend direction.
Limits of the liquidity concept
- Inferred, not observed. “Stop clusters” are a reasonable assumption, not visible data.
- Hindsight makes it look obvious. On a past chart every sweep looks clear; in real time it does not.
- Markets behave differently. Thin stocks, forex and crypto react differently to the same pattern.
- Validate it. Measure liquidity-based setups on your own data before trusting them. Historical results, before costs.
Practical checklist
- Mark obvious highs and lows, especially equal highs and equal lows.
- Avoid placing stops right below an obvious low or above an obvious high.
- Wait for the close: a wick through and back differs from a close through.
- Read sweeps in the direction of the main trend; do not pick bottoms against it.
- Remember liquidity is inferred from the chart, not read from a real order book.
Video Explainer
The video for this article is in production. The full written lesson is already complete.
Video chapters
- A stop tagged by a few ticks
- Where resting orders cluster
- The liquidity sweep
- Liquidity in AURORA Pro
- Limits of the concept
Show transcript
Product documentation
Educational and decision-support content, not investment advice. Chart examples are illustrative or historical and do not guarantee future results. Trading carries a risk of capital loss.