Is a wick through a low that snaps back a trap, or an opportunity?
After this lesson you will
- Define a Sweep and an MSS with concrete conditions
- Tell a real sweep from an ordinary wick
- Know why AURORA uses the pattern only with the trend and places a structural stop
What is a Sweep + MSS?
The pattern has two steps, for example in an uptrend:
- Sweep (liquidity sweep). During a pullback, price pierces an obvious swing low and closes back above it. The wick below the low is where many stops and breakout sell orders get triggered.
- MSS (market structure shift). After the sweep, a candle closes above the latest high of the pullback. The short-term down leg has now broken structure, showing buyers are back.
In a downtrend everything is mirrored: sweep the pullback high, then close below the latest low.
Why do SMC traders watch this pattern?
The logic of Smart Money Concepts is that price tends to travel to areas rich in liquidity, such as clusters of stops below obvious lows. A sweep that snaps back shows that liquidity was absorbed without price following through. The MSS confirms that control has changed hands.
The practical value: the pattern gives a clear invalidation level, the extreme of the sweep. If price returns beyond it, the idea is wrong.
Common misunderstandings
- Every wick below a low is a sweep. If the candle does not close back above the swept level, it may be a real breakdown.
- Trading sweeps against the main trend. Bottom-picking with sweeps in a strong downtrend is a very different, much riskier strategy.
- Drawing swings with hindsight. Highs and lows are only confirmed after a few bars; drawing them by eye on a finished chart makes the pattern look more precise than it is.
- Treating an MSS (or a BOS or CHoCH) without a candle close. A wick above a high is not yet a structure shift.
- Ignoring stop distance. A deep sweep creates a distant stop; keeping the usual size raises the real risk.
Chart example
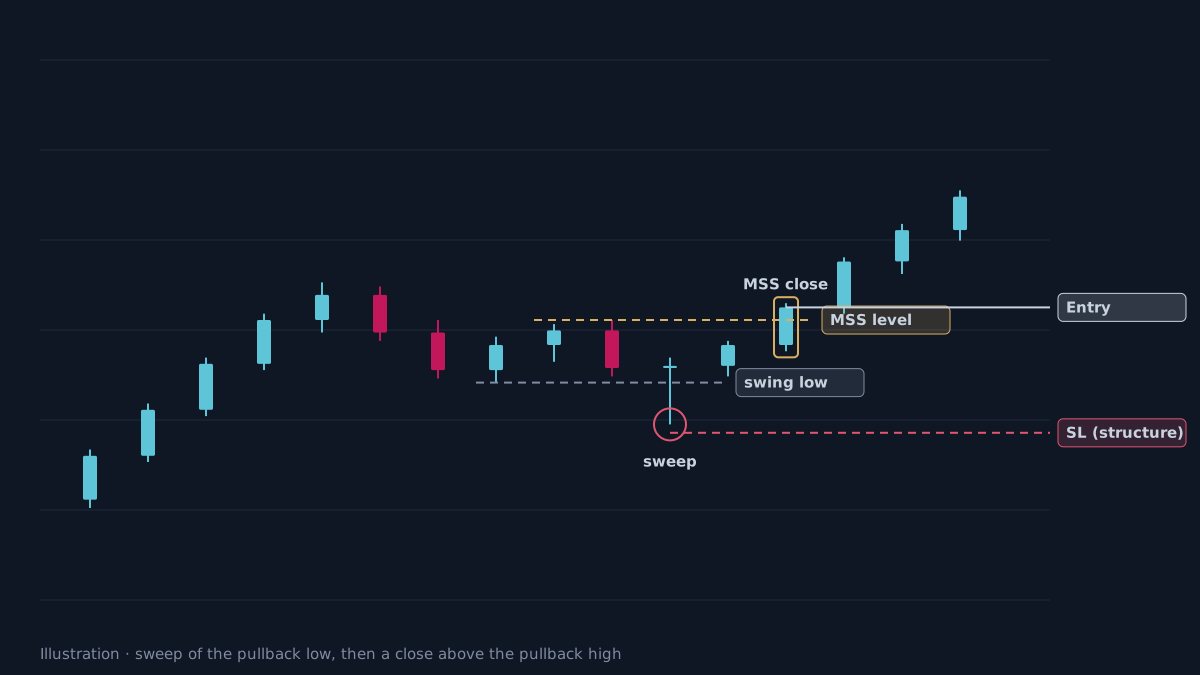 Illustration, not real market data. The red circle is the sweep of the swing low; the gold box is the candle closing above the MSS level.
How does AURORA Pro define the SMC SWEEP?
AURORA Pro turns the pattern into fixed rules so that statistics reflect exactly how the indicator behaves:
- With the trend only. The setup is considered only within a trend cycle in the same direction, and by default price must be on the right side of the Trailing line.
- Swings are confirmed after 3 bars on each side and do not repaint.
- The sweep: a wick beyond a recent pullback swing, with the candle closing back inside.
- MSS within 8 bars: a candle closes beyond the latest high (or low) of the pullback. If time runs out or price makes a new extreme, the setup is cancelled.
- Structural stop: a small buffer beyond the sweep extreme, at least 0.3 ATR. When the stop is wider than 4 ATR, the label shows
⚠SL(the default mode only warns). - Priority: if a BREAK or SUNNY appears on the same candle, that setup takes priority over SMC.
- SMC Quality scores the setup but by default only records statistics; it never blocks trades on its own.
Limits of the pattern
- Liquidity is an inferred model. A candlestick chart does not show the real order book; “stop clusters” are a reasonable assumption, not observed data.
- Late confirmation. Swings need a few bars to confirm and the MSS needs a candle close, so the entry is usually further from the low than hindsight suggests.
- Reward to risk can be poor. When the MSS comes after a sharp bounce, the stop is far and the remaining move may be short.
- Rare in strong trends. One-way trends seldom produce pullbacks deep enough for a sweep.
- Validate it separately. Compare SMC SWEEP with RETEST and IFVG, and normal stops with wide stops, across many symbols and out-of-sample data before switching on any filter.
Practical checklist
- Identify the main trend first; look for sweeps only in that direction.
- The swept swing must be a confirmed swing, not a high or low drawn after the fact.
- The sweep candle must close back inside the swept level.
- The MSS needs a candle closing beyond the latest pullback high (or low), within a limited number of bars.
- Place the stop beyond the sweep extreme; if it is too far, reduce size or skip.
Video Explainer
The video for this article is in production. The full written lesson is already complete.
Video chapters
- Trap or opportunity
- Where liquidity sits
- Sweep, then MSS
- The rules in AURORA Pro
- Limits of the pattern
Show transcript
Product documentation
Educational and decision-support content, not investment advice. Chart examples are illustrative or historical and do not guarantee future results. Trading carries a risk of capital loss.