A breakout happens right after price sweeps an old low: does that make the setup more trustworthy?
After this lesson you will
- Know the four Tier 3 components and what each measures
- Understand data coverage and why Tier 3 does not decide when data is missing
- Read the 💎 label and the Tier 3 and Sweep rows on the dashboard
What is Tier 3?
AURORA Pro scores in separate layers:
- Score: the market context.
- Setup Quality: the quality of the setup itself.
- Tier 3, or Institutional Quality: traces often associated with large money flow around the setup.
Tier 3 has four components:
| Component | What it measures |
|---|---|
| ① Fresh FVG | A same-direction FVG that formed recently (within 8 bars by default), is large enough (0.2 ATR or more) and has not been filled to its midpoint |
| ② Liquidity sweep | Price just swept a recent high / low and closed back inside (searched over 15 bars, valid for 8 bars, decaying over time) |
| ③④ CVD and absorption | Whether cumulative CVD leans towards the trade direction; whether there are signs of the other side being absorbed |
| Runner suitability | Whether the trend has enough efficiency, strength, higher-timeframe agreement and AVWAP location to hold a long-running part of the position |
Weights differ between BREAK and SUNNY: for BREAK, the FVG and the sweep matter more; for SUNNY, flow and Runner suitability matter more.
Data coverage: the share of components that actually had data at the setup. 100% means all four did; 50% means only two.
Classes: S from 85, A from 75, B from 60, C below 60.
Why do these traces deserve attention?
- Sweep, then breakout suggests liquidity on the other side was used up before price moved in the setup’s direction.
- A fresh FVG shows the last push was strong enough to leave a price gap, and that zone may serve as a pullback level.
- CVD and absorption indicate whether (estimated) aggressive buying and selling support the trade direction.
- Runner suitability helps decide whether to keep part of the position for a long trend run.
Common misunderstandings
- Tier 3 sees institutional orders. No. A candlestick chart shows neither the order book nor who is trading. “Institutional” refers to patterns commonly attributed to large money flow.
- CVD on TradingView is a real footprint. Delta and CVD in AURORA are estimated from lower-timeframe bars, not native bid / ask exchange data.
- A Tier 3 score is meaningful even with missing data. A score built on a single component is easy to misread; that is why Filter mode requires a minimum coverage.
- A 💎 always means better. It is a hypothesis to test on your data, not a default truth.
Chart example
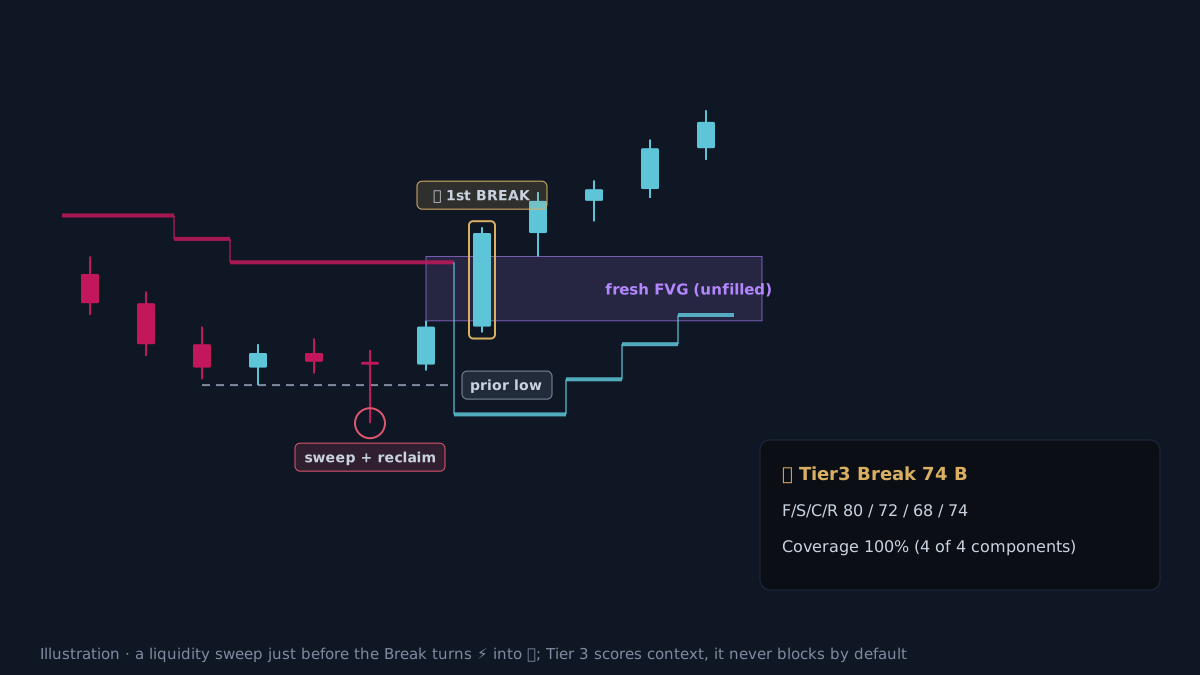 Illustration with hypothetical values.
Price sweeps an old low and closes back inside. A few candles later the 1st BREAK appears and leaves an unfilled FVG. The label changes from ⚡ to 💎, and the tooltip shows 💎 Tier3 Break 74 B F/S/C/R 80/72/68/74 · Cov 100%.
How does AURORA Pro use Tier 3?
- Three modes (the Tier 3 mode box):
- Off.
- Stats only (default): scores and records, signals unchanged.
- Filter (experimental): blocks setups below the threshold, 65 for Break and 60 for SUNNY by default, with minimum coverage of 50%.
- The 💎 label replaces ⚡ on a BREAK when a liquidity sweep happened just before.
- Display:
- The dashboard: a
💎 Tier 3row with the current score for BUY and SELL. The Full layout adds a💎 Sweeprow comparing the average R of Breaks with and without a sweep. - JSON: the
tier3_qualityandsweepfields. - Strategy Validator: trade names, for example
BREAK-L Q72 T65.
- The dashboard: a
- FVG CE option for Pullback: places the limit order at the midpoint of a fresh FVG instead of a percentage; off by default.
- Runner suitability drives the Tier3 adaptive Runner mode: the Runner is kept only when this score is 70 or above at entry.
Limits of Tier 3
- Estimated data. CVD and absorption depend on how much lower-timeframe data your TradingView plan allows, and on the market’s volume quality (forex tick volume, reference volume for CFDs).
- Interpretive patterns. FVGs and sweeps are defined by fixed rules, but the concepts themselves remain chart interpretations.
- Small samples. Breaks with a sweep are relatively rare; the
💎 Sweeprow needs time to collect enough trades. - Validate before filtering. Switch on Filter only when high-score groups show clearly better average R across many symbols and out-of-sample data. Historical results, before costs.
Practical checklist
- Read Tier 3 as extra context, not as an entry condition.
- Check the data coverage (Cov): below 50% the score means little.
- Compare the 💎 Sweep row with the no-sweep row on the dashboard.
- Remember that CVD on TradingView is an estimate, not native bid / ask data.
- Switch on Filter only after validating across many symbols and out-of-sample data.
Video Explainer
The video for this article is in production. The full written lesson is already complete.
Video chapters
- A breakout right after a sweep
- The four Tier 3 components
- Data coverage
- The 💎 label and the dashboard
- The limits of estimated data
Show transcript
Product documentation
Educational and decision-support content, not investment advice. Chart examples are illustrative or historical and do not guarantee future results. Trading carries a risk of capital loss.