The question
The word "volume" appears on both a gold chart and a stock chart: is it really the same thing?
After this lesson you will
- Tell exchange volume, tick volume, reference volume and estimated Delta apart
- Know why results can differ between brokers and data sources
- Read the data-source labels on the AURORA dashboard
What is data provenance?
Every number on a chart has a provenance: who produced it, what it measures, and what its limits are. For volume and money flow, the common sources are:
| Kind of data | Where you find it | What it measures | How usable |
|---|---|---|---|
| Exchange volume | Stocks, crypto, futures | Real traded volume | Fully: RVOL, VWAP, CMF, Delta |
| Tick volume | Forex, many broker CFDs | Number of price changes | Relative terms only (RVOL) |
| Reference volume | Gold and index CFDs (borrowed from futures) | Volume of a related market | Useful, but not the CFD’s own volume |
| Estimated Delta / CVD | Calculated from lower-timeframe candles | Estimated aggressive buying vs selling | Reference only, not native bid / ask data |
| Open Interest | Crypto perpetuals, futures | Open contracts | Combined with price to read new money flow |
Beyond volume, higher-timeframe data has a provenance issue too: an unfinished higher-timeframe bar keeps changing, so using it historically easily “sees the future”.
Why does data provenance matter?
- Same name, different nature. “Volume” on a forex chart and on a stock chart are completely different things.
- Results differ between brokers. Prices, candle close times, spreads and tick volume vary by broker, so the same strategy can produce different statistics.
- Avoiding false conclusions. A volume filter that “works” on tick volume may only reflect the broker’s activity hours, not real money flow.
Common misunderstandings
- Tick volume is real money flow. No. It correlates with activity but does not measure traded volume.
- Futures volume is the CFD’s volume. It is the volume of a related market, with its own trading hours and roll dates.
- Delta on TradingView is native order flow. Delta on candlestick charts is an estimate, limited by how much lower-timeframe data your plan allows.
- Data is the same at every source. Continuous futures symbols can show price gaps at contract rolls; two brokers’ CFD prices can differ.
Chart example
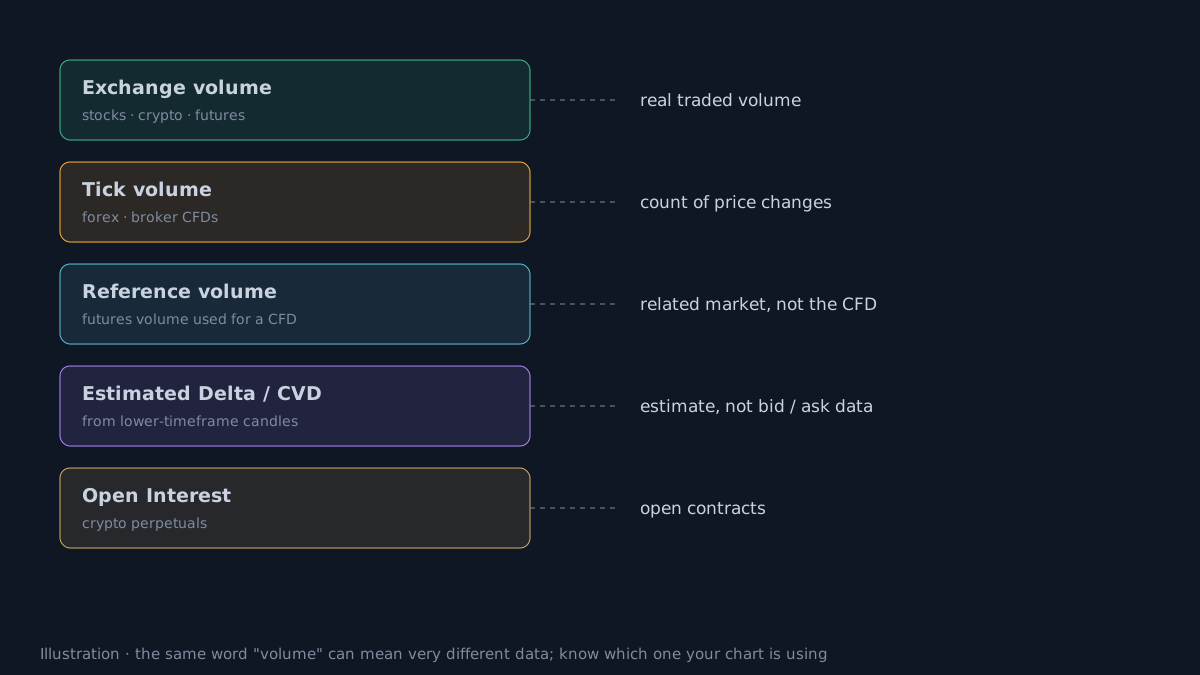 Illustrative diagram.
How does AURORA label its data sources?
- The Market Preset decides the volume source:
- STOCK: full real volume.
- FOREX: RVOL from tick volume only.
- CFD: reference volume from futures.
- CRYPTO: exchange volume + Open Interest.
- External volume for CFDs:
- AURORA Standard V12.2: requires entering the symbol and ticking a confirmation box. The dashboard shows
EXT !CONFIRM(not confirmed),EXT ✓(data available) orEXT NO DATA. - AURORA Pro: picks the contract from the chart symbol automatically, for example XAU → COMEX:GC1!. An unrecognised symbol shows
EXT ?and volume is switched off, rather than using the wrong symbol.
- AURORA Standard V12.2: requires entering the symbol and ticking a confirmation box. The dashboard shows
- No mixing of sources: in external-volume mode, a bar without external data is treated as having no volume; chart volume is not used to fill the gap, because the two sources have different scales. The score loses 5 points when external volume cannot be loaded.
- Reference metrics are marked: with external volume, the tooltip shows
pVWAP,pCMFinstead ofVWAP,CMF. - Delta is labelled as a lower-timeframe estimate. AURORA Pro uses it for CVD in Tier 3.
- Higher-timeframe data comes only from closed bars. Signals confirm on bar close by default.
- RVOL~ on the dashboard is a projection for the live candle, not its final value.
What a candlestick chart cannot tell you
- The order book and who is trading. Not on a candlestick chart.
- Off-exchange data. Trades that do not go through an exchange (OTC) are not shown.
- Your broker’s execution quality. Real slippage and latency only show up in your own account.
- So: always state the symbol, exchange or broker and timeframe when sharing results, and validate on the exact data source you trade. Historical results, before costs.
Practical checklist
- Know whether the volume on your chart is exchange volume, tick volume or reference volume.
- Do not compare results from two brokers as if they were the same data.
- For CFDs, confirm that the reference futures symbol matches the market you trade.
- Read Delta and CVD as estimates, not native order flow.
- Check the data status on the dashboard before trusting volume metrics.
Video Explainer
The video for this article is in production. The full written lesson is already complete.
Video chapters
- Same word, different data
- Five common kinds of data
- Why brokers give different results
- How AURORA labels data sources
- What a candlestick chart cannot tell you
Show transcript
A stock chart and a gold CFD chart both show volume bars. But one is the exchange's real traded volume, while the other is usually just the number of price changes recorded by the broker.
Knowing where data comes from decides how far you can trust a metric. Exchange volume measures real trading. Tick volume only works in relative terms. Reference volume is borrowed from a related market. Delta on candlestick charts is an estimate.
AURORA labels the source of each number: external volume has its own dashboard status, metrics based on reference volume are marked, and higher-timeframe data comes only from closed bars.
Finally, remember that the same symbol at two brokers can produce different results, because their price and volume data are not identical.
Product documentation
Educational and decision-support content, not investment advice. Chart examples are illustrative or historical and do not guarantee future results. Trading carries a risk of capital loss.