A strong green candle with big volume: is that money flowing in, or just the US session opening?
After this lesson you will
- Understand what volume measures and what it does not
- Compare volume with the normal level for the same hour (RVOL)
- Know where the volume on your chart comes from
What is volume?
Volume is how much traded within a candle: shares, contracts, or (for forex) the number of price changes. Volume shows participation: whether the market is busy or quiet.
Every trade has one buyer and one seller, so volume does not by itself say which side won. To read that, you have to read volume together with the candle.
What does volume tell you?
- Participation: a breakout with above-normal volume shows more traders taking part.
- Effort and result: high volume with a long move is effort with result; high volume while price barely moves suggests the other side is absorbing.
- Changes in behaviour: volume building over several candles is more reliable than a single spike.
Common misunderstandings
- High volume is a buy signal. High volume at the end of a long rally may be sellers taking profit.
- Compare volume with the daily average. Volume is always high at major session opens. Compare with the same hour on previous days; that is time-of-day RVOL.
- Forex volume is real money flow. Most of it is tick volume: the number of price changes, only useful in relative terms.
- Gold CFD volume is exchange volume. CFDs have no native exchange volume; gold futures volume is only reference volume.
Chart example
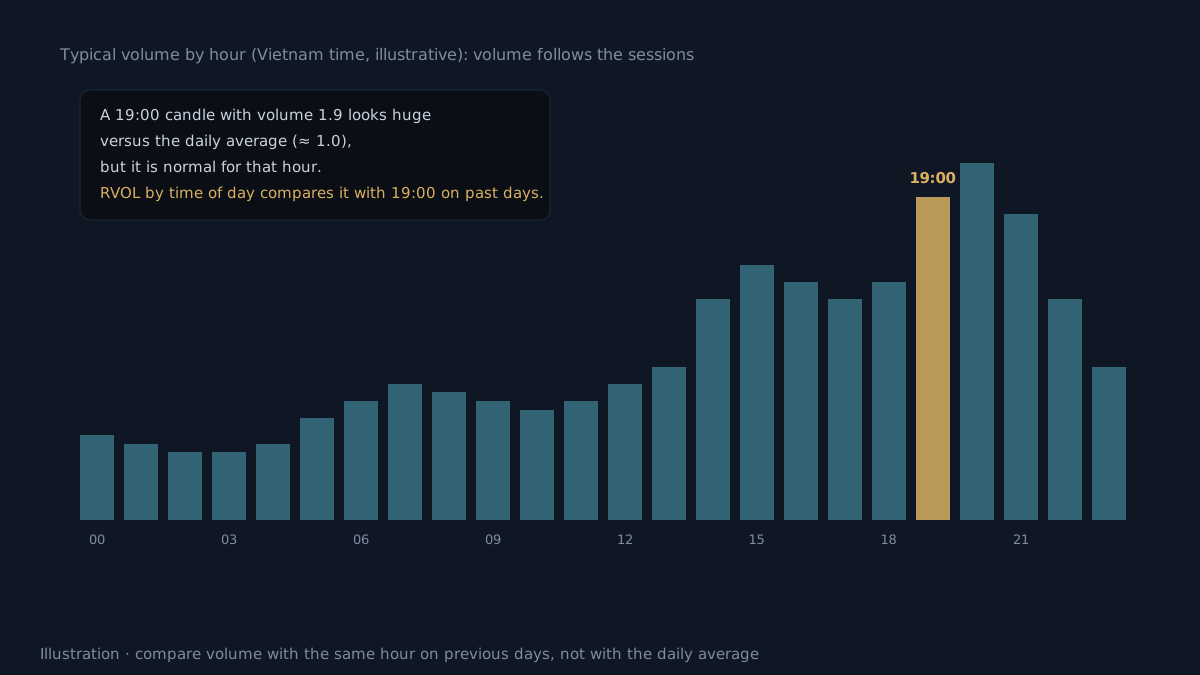 Illustration. The 19:00 candle has almost twice the daily average volume, but that is normal for that hour.
How does AURORA use volume?
-
The Volume Engine adds Score points from factors you can switch on or off:
- Time-of-day RVOL.
- Position relative to VWAP.
- Chaikin Money Flow.
- Delta estimated from a lower timeframe.
- Open Interest (crypto).
Factors without data are skipped, not penalised.
-
The Market Preset picks the right volume source:
- STOCK uses full exchange volume.
- FOREX uses RVOL only.
- CFD uses reference volume from futures.
- CRYPTO uses exchange volume and Open Interest.
-
Volume Quality scores volume together with the candle and flags absorption.
-
The volume filter is off by default.
-
The dashboard has a
🔊 Volumerow with current RVOL and the data source.
What does volume not tell you?
- Where price goes next. Volume describes what happened inside the candle; it does not forecast.
- Who is trading. The chart does not show whether it is a large fund or a small investor.
- The whole market. For forex and CFDs, volume belongs to the broker or the reference market, not to all trading.
Practical checklist
- Know whether your chart's volume is exchange volume, tick volume or reference volume.
- Compare volume with the same hour on previous days, not the daily average.
- Read volume with the candle: high volume should come with price movement.
- Do not use volume as your only buy or sell signal.
- On forex, use volume only in relative terms.
Video Explainer
The video for this article is in production. The full written lesson is already complete.
Video chapters
- Big volume means money in?
- What volume measures
- Volume changes by hour
- Volume in AURORA
- What volume does not say
Show transcript
Product documentation
Educational and decision-support content, not investment advice. Chart examples are illustrative or historical and do not guarantee future results. Trading carries a risk of capital loss.