Two candles both trade twice their normal volume: why is one a real push and the other a warning?
After this lesson you will
- Understand time-of-day RVOL and why volume should not be compared with the daily average
- Recognise effort with result, and absorption, on a single candle
- Know how volume sources differ between stocks, forex, CFDs and crypto
What is Volume Quality?
Volume tells you how many contracts or shares changed hands, but not which side won. Volume Quality (VQ) reads volume together with the candle, on a 0–100 scale, separately for buying and selling. It combines four parts:
| Component | Question | Weight |
|---|---|---|
| RVOL | How large is volume relative to normal (taking the highest of the last 3 candles)? | 35 |
| Delta direction | Does estimated aggressive buying and selling lean towards the trade direction? | 25 |
| Effort and result | Does the candle body move in the right direction, in proportion to the volume? | 20 |
| Volume expansion | Is the average volume of the last 3 candles rising? | 20 |
A component without data is dropped and the rest are reweighted.
Why is high volume not always good?
- Effort needs a result. High volume with a long body in the trade direction is a real push. High volume while price barely moves suggests the other side is absorbing the orders.
- Volume changes by time of day. Volume at the New York open is always higher than at Asian midday. RVOL should compare with the same time on previous days; otherwise every session-open candle looks like a spike.
- One candle is not enough. Volume expanding over several candles is more reliable than one isolated bar.
Common misunderstandings
- High volume is a buy signal. High volume at the end of a long rally may be sellers taking profit.
- Forex tick volume is real money flow. Tick volume counts price changes, not exchange trading volume. It is only useful in relative terms (RVOL).
- Delta on TradingView is native order flow. Delta on candlestick charts is usually estimated from lower-timeframe bars, not native bid / ask exchange data.
- CFD volume is exchange volume. Gold or NAS100 CFDs have no native exchange volume; using the matching futures contract’s volume is only a reference volume.
Chart example
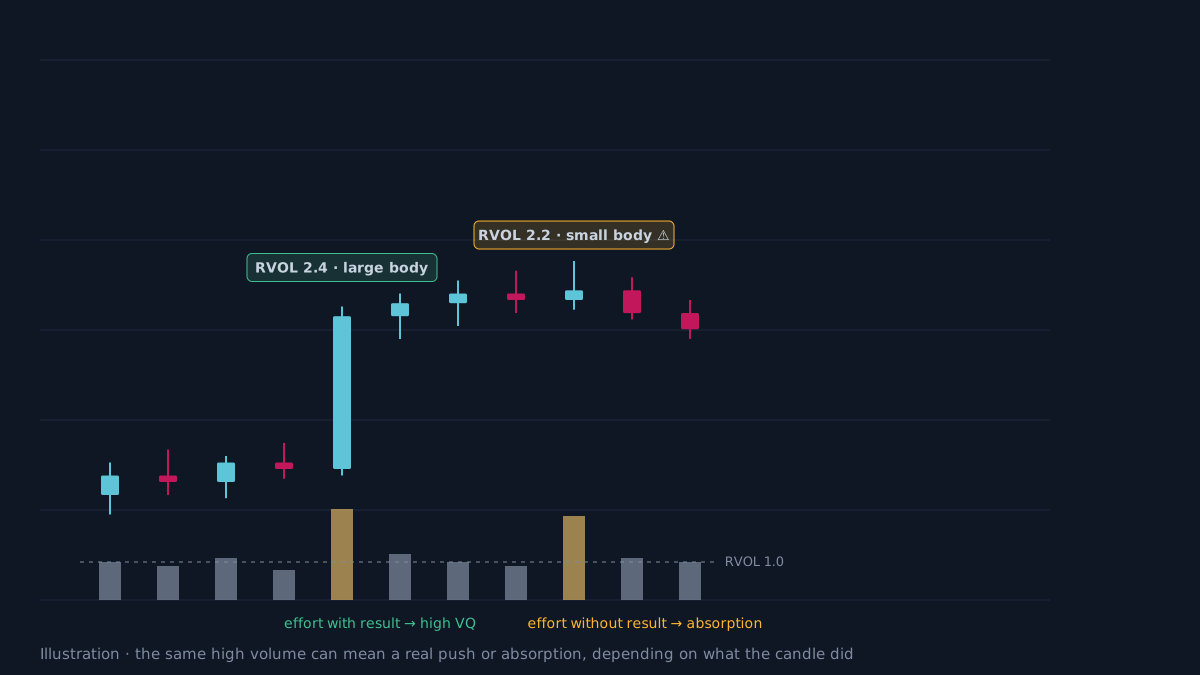 Illustration, not real market data. The gold volume bars are the two candles with RVOL above 2.
The first candle: RVOL 2.4, a long body closing near the high, so VQ is high. The second: RVOL 2.2 but a very small body, so it is flagged as absorption even though its volume is almost the same.
How does AURORA use Volume Quality?
-
Time-of-day RVOL: compared with volume at the same time over the last 10 days (at least 3 samples). Without enough data, or on daily and higher charts, it falls back to the median of the previous 20 candles.
-
RVOL thresholds: 1.3 and above is strong, below 0.7 is weak. On the live candle, the dashboard shows
RVOL~, a projection based on elapsed time. -
Absorption flag: RVOL at or above the strong level but a candle smaller than 0.6 ATR or a very weak body. The tooltip shows
⚠ absorption. -
The volume filter is off by default. Three choices:
- Off.
- RVOL ≥ Strong.
- Volume Quality ≥ min (45 by default, with no absorption flag).
In AURORA Pro, BREAK, SUNNY and SMC each have their own filter box.
-
No data blocks everything. If the filter is on in a market without usable volume, every setup is blocked for safety. Switch it on only when you are sure the data exists.
-
Volume source by Market Preset:
| Market | Source | Usable for |
|---|---|---|
| Stocks | Real exchange volume | RVOL, VWAP, CMF, Delta |
| Forex | Tick volume | RVOL only |
| CFD (gold, indices) | Reference volume from the matching futures contract | RVOL, VWAP, CMF, Delta (all reference) |
| Crypto | Exchange volume + Open Interest | All, OI for perpetual pairs |
- AURORA Standard V12.2: to use external volume for CFDs, you must enter the futures symbol and tick the confirmation box. The dashboard shows
EXT !CONFIRM,EXT ✓orEXT NO DATA. - AURORA Pro: picks the contract from the chart symbol automatically, for example XAU → COMEX:GC1!, NAS100 → CME_MINI:NQ1!.
Limits of Volume Quality
- Reference volume does not match the CFD exactly. Futures trading hours and roll dates do not line up perfectly with the CFD.
- Delta is an estimate. It depends on how much lower-timeframe data your TradingView plan allows.
- Quiet hours. Low volume makes RVOL jumpy; a single large order can push it high.
- Filters easily become too strict. The ⛔ Filtered dashboard row tracks blocked setups. If it is positive, the filter may be blocking good trades; also look at average R, drawdown and trade count before concluding. Historical results, before costs.
Practical checklist
- Compare volume with the same time of day on previous days, not with the daily average.
- High volume should come with a candle body in the right direction; high volume with a small candle is a warning.
- Know where your volume comes from: a real exchange, tick volume, or a futures reference.
- Do not switch on a volume filter in markets without usable volume data.
- Check the ⛔ Filtered row before keeping a volume filter.
Video Explainer
The video for this article is in production. The full written lesson is already complete.
Video chapters
- Two candles, both at double volume
- Time-of-day RVOL
- Effort and result, and absorption
- Volume Quality in AURORA
- Where volume comes from
Show transcript
Product documentation
Educational and decision-support content, not investment advice. Chart examples are illustrative or historical and do not guarantee future results. Trading carries a risk of capital loss.