The question
A system shows +0.15R per trade on the chart: what is left after commission and slippage?
After this lesson you will
- List the cost components of a trade
- Convert costs into R using the stop distance
- Set commission and slippage correctly in the Strategy Validator
What does a trade cost?
| Cost | Common in | Notes |
|---|---|---|
| Commission | Stocks, crypto (percentage), futures (per contract) | Paid on every fill, including partial exits |
| Spread | Forex, CFDs | The bid / ask gap; widens around news and in quiet hours |
| Slippage | Every market | The fill differs from the intended price; larger in fast markets |
| Overnight financing (swap) | CFDs, forex, crypto perpetuals (funding) | Charged when holding overnight |
Converting costs into R
Cost per trade (R) = Total round-trip cost ÷ Stop distance
Example: a system with +0.15R expectancy before costs and a round-trip cost of 0.30 price units:
| Stop distance | Cost in R | Expectancy after costs |
|---|---|---|
| 6 | 0.05R | +0.10R |
| 3 | 0.10R | +0.05R |
| 1.5 | 0.20R | −0.05R |
| 1 | 0.30R | −0.15R |
Same system, same costs. Only because the stop is tighter, the edge becomes a loss.
Why does it matter?
- Most edges are small. A few tenths of an R per trade is normal; costs can eat all of it.
- Tight stops look attractive because of large size. But costs in R grow in proportion.
- More trades multiply costs. High-frequency systems on low timeframes are the most cost-sensitive.
Common misunderstandings
- Fees are small and negligible. In R they become obvious; 0.1R per trade can be two thirds of the expectancy.
- Spreads are fixed. Spreads widen sharply around news, session opens and quiet hours.
- Limit orders have no slippage. Limit orders do not fill worse than their price, but may not fill at all when price only just touches them.
- Backtests without costs are fine for comparison. Comparing configurations with different trade frequencies requires costs.
Chart example
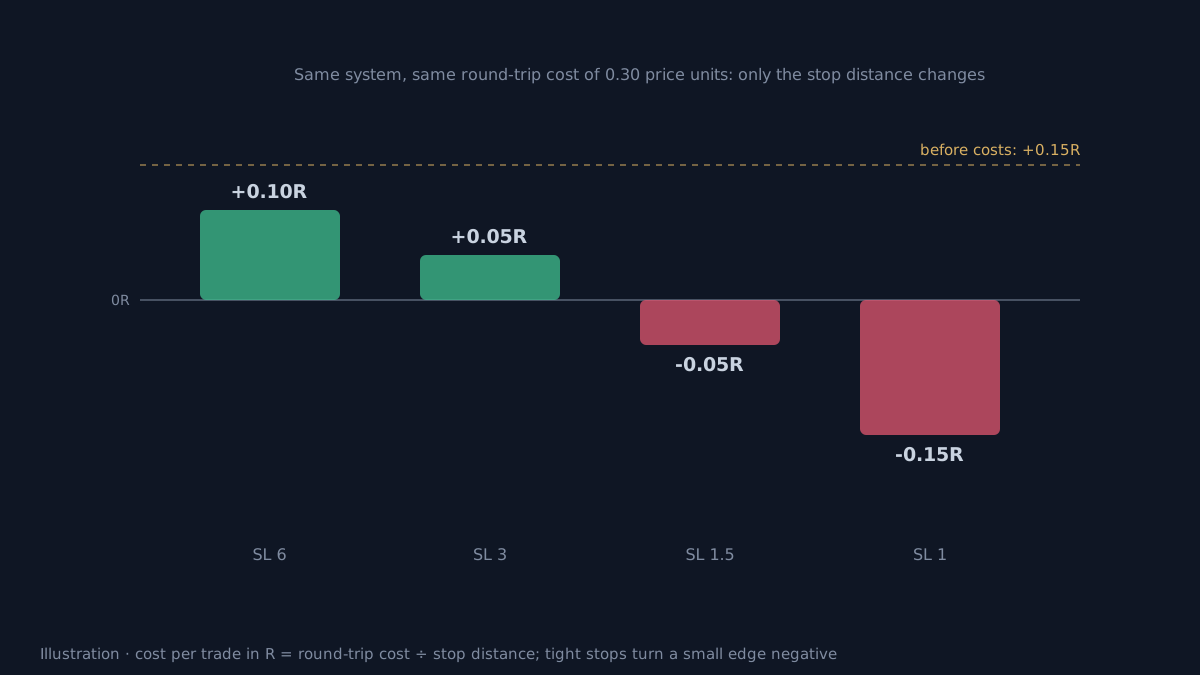 Illustration with hypothetical values.
Setting costs in AURORA’s Strategy Validator
- The Validator’s defaults are 0.05% per trade + 2 ticks of slippage: placeholders only. Open Strategy Properties and enter real figures:
- Stocks, crypto: a percentage commission.
- CME / COMEX futures: a fee per contract.
- CFDs, forex: mostly the spread; set slippage high enough to reflect the average spread plus slippage.
- Pullback limit orders: the Verify price for limit orders setting. Compare 0 ticks with 1 tick or more to see how the fill assumption changes results.
- Partial exits: 50 / 50 or 50 / 25 / 25 plans create more fills; with brokers that charge a minimum per order, costs rise.
- The chart dashboard excludes costs. Always use the Validator for figures after costs before trading real money.
Limits
- Real costs vary over time, especially spreads around news; an average is only an approximation.
- Overnight financing depends on the broker and product, and is rarely fully modelled in backtests.
- Testing live with small size is the only way to know your exact costs.
Practical checklist
- Know every cost of what you trade: commission, spread, slippage, overnight financing.
- Convert the total round-trip cost into R: cost ÷ stop distance.
- Be careful with very tight stops: cost in R shoots up.
- Replace the Strategy Validator's default costs with your broker's real figures.
- Judge systems by results after costs.
Video Explainer
The video for this article is in production. The full written lesson is already complete.
Video chapters
- What is left of +0.15R
- The kinds of cost
- Converting costs into R
- Tight stops and a vanishing edge
- Setting costs in the Strategy Validator
Show transcript
A system shows +0.15R per trade on the chart. But every trade pays commission, spread and slippage.
The simple conversion: cost in R equals the round-trip cost divided by the stop distance. With a cost of 0.3 price units, a stop of 6 means 0.05R, while a stop of 1.5 means 0.2R.
So for the same system with the same costs, just tightening the stop turns a +0.15R edge into a loss.
That is why you should always judge a system after costs, and set the Strategy Validator's costs to match your broker.
Product documentation
Educational and decision-support content, not investment advice. Chart examples are illustrative or historical and do not guarantee future results. Trading carries a risk of capital loss.