A filter halves your trade count and lifts the win rate: is the filter actually good?
After this lesson you will
- Understand why judging a filter means looking at the trades it blocks
- Read the ⛔ Filtered row and the ⛔ labels with their reasons
- Know why a positive Filtered row is not automatic proof that the filter is wrong
What are filtered and ghost trades?
Every filter (minimum score, session, volume, stop distance…) splits setups into two groups: taken and blocked. Most traders only look at the first.
A ghost trade is how you look at the second: a blocked setup is still tracked in the background as if it had been taken, with the same stop, the same targets, the same exit rules. When the ghost trade ends, its result in R is recorded separately.
Why measure the blocked trades too?
- Any filter changes the statistics of what remains, even one that blocks at random. A higher win rate proves nothing on its own.
- The right question compares the two groups. A filter helps when the average R of blocked trades is clearly lower than that of taken trades.
- Blocking good trades is a cost too. Every good trade blocked is missed profit, and fewer trades make the statistics less reliable.
Common misunderstandings
- A positive Filtered row means the filter is wrong. It is only a sign the filter may be too strict. Judge it alongside average R, drawdown, trade frequency and out-of-sample behaviour.
- A negative Filtered row means the filter is good. Not enough. If the taken trades are negative too, the filter is just choosing between two poor groups.
- A higher win rate is enough. A filter can raise the win rate but lower average R if it blocks the trades that run far.
- A handful of ghost trades is enough to decide. The blocked group is usually small; a few big winners can make it look very different.
Chart example
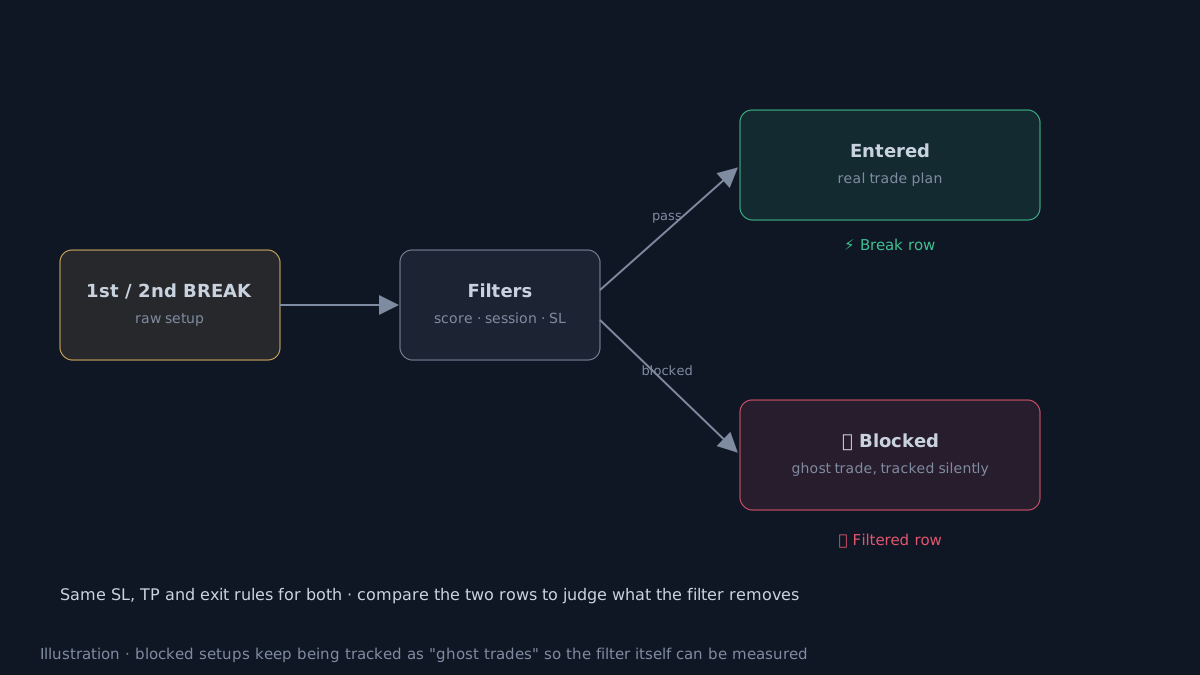 Illustrative diagram.
Two scenarios with hypothetical numbers:
| BREAKs taken | ⛔ Filtered | Reading | |
|---|---|---|---|
| A | 22 trades · +0.28R / trade | 9 trades · −0.27R / trade | The filter is removing weaker trades. |
| B | 22 trades · +0.28R / trade | 9 trades · +0.35R / trade | The filter may be too strict; gather more data before loosening it. |
How does AURORA track filtered trades?
- A
⛔ 1st/⛔ 2ndlabel appears on the blocked BREAK candle. Hover to see the reason, for example:- Score below the minimum.
- Stop too far (in ATR).
- Weak volume or an absorption flag.
- A filtered session, or a NO-TRADE zone.
- Stop on the wrong side of price.
- The ghost trade uses the same F-SL, TP1, TP2, exit policy and breakeven setting as a real trade.
- The ⛔ Filtered row on the dashboard: ghost trade count, win rate, total R and average R. The result cell is green when total R ≤ 0 (the filter is removing weaker trades) and red when positive.
- AURORA Pro only: blocked SUNNY and SMC setups also show
⛔ SUN/⛔ SMClabels with reasons. Ghost trades are currently tracked for BREAK only.
Without AURORA you can do the same: log the setups you skipped and their “what if I had taken it” result in your journal.
Limits of ghost trades
- Small samples. The blocked group is usually small; conclusions need enough data and an out-of-sample check.
- No competition for capital. Ghost trades run independently of real trades and can overlap them, so they do not reflect capital limits or one-position-at-a-time.
- One ghost trade at a time. While a ghost trade is open, the next blocked BREAK is not tracked, so the Filtered row can undercount.
- Filters depend on market phase. A filter that blocks correctly in a strong trending year can block wrongly in a ranging year. Check several periods before changing settings. Historical results, before costs.
Practical checklist
- Compare the average R of taken and blocked trades, not only the win rate.
- Read the reasons in the ⛔ label tooltips to see which filter blocks most.
- When the Filtered row is positive, check drawdown, trade count and out-of-sample data before loosening the filter.
- Change one filter at a time.
- Confirm with the Strategy Validator on an out-of-sample period.
Video Explainer
The video for this article is in production. The full written lesson is already complete.
Video chapters
- Fewer trades, more wins?
- Blocked trades must be measured too
- The Filtered row in AURORA
- What positive or negative means
- Limits of ghost trades
Show transcript
Product documentation
Educational and decision-support content, not investment advice. Chart examples are illustrative or historical and do not guarantee future results. Trading carries a risk of capital loss.