Two 1st BREAKs both meet the rules: why does one run far while the other reverses at once?
After this lesson you will
- Tell Score (market context) apart from Setup Quality (the quality of the setup itself)
- Know what the six BreakQ and SunnyQ components measure
- Know how to validate a quality score before switching on filter mode
What is Setup Quality?
Score answers “is the market context favourable?”. Setup Quality answers a different question: “how good is this particular setup?”. It is a separate 0–100 score, not mixed into Score.
BreakQ (for the 1st / 2nd BREAK) has six components:
| Code | Component | What it measures |
|---|---|---|
| C | Compression → expansion | Whether the market compressed before expanding; overly long candles (above about 2.5 ATR) are penalised because they tend to retrace |
| A | Acceptance | Breaking a recent structural high / low, closing near the candle’s extreme, a large body, few opposing wicks |
| K | Path efficiency | Whether the recent price path is “clean” or noisy (Kaufman Efficiency Ratio) |
| D | ADX / DMI | Whether the trend has strength and is accelerating |
| V | Cycle AVWAP location | Where price sits relative to a VWAP anchored at the start of the trend cycle |
| F | Flow | Whether Delta and volume participate |
Weights differ between the 1st and 2nd BREAK: the 1st BREAK leans more on compression / expansion and flow; the 2nd BREAK leans more on path efficiency and AVWAP location.
SunnyQ (for SUNNY) uses path efficiency, ADX / DMI, AVWAP location, pullback quality (price pulled back near the balance area while holding the right side of the Trailing line), recovering flow, and a normal volatility regime.
Classes: S from 85, A from 75, B from 65, C below 65.
Why score each setup separately?
- Same rules, different quality. A breakout after a tight compression is very different from a breakout in the middle of a choppy market.
- Score does not see the candle’s details. A high Score can come with a weak, wicky breakout candle.
- Separate to measure. Keeping Quality apart from Score lets you test whether each layer adds value, instead of blending everything into one number.
Common misunderstandings
- High quality means a guaranteed win. No. It is a descriptive score, not a probability. Its value has to be proven with statistics.
- Switch on Filter straight away to be safe. Filtering on an unvalidated score can block exactly the best trades.
- One symbol showing an effect is enough. A scoring layer is valuable when the effect repeats across many symbols and periods.
- Every component always has data. Flow depends on volume; a component without data is dropped and the rest are reweighted.
Chart example
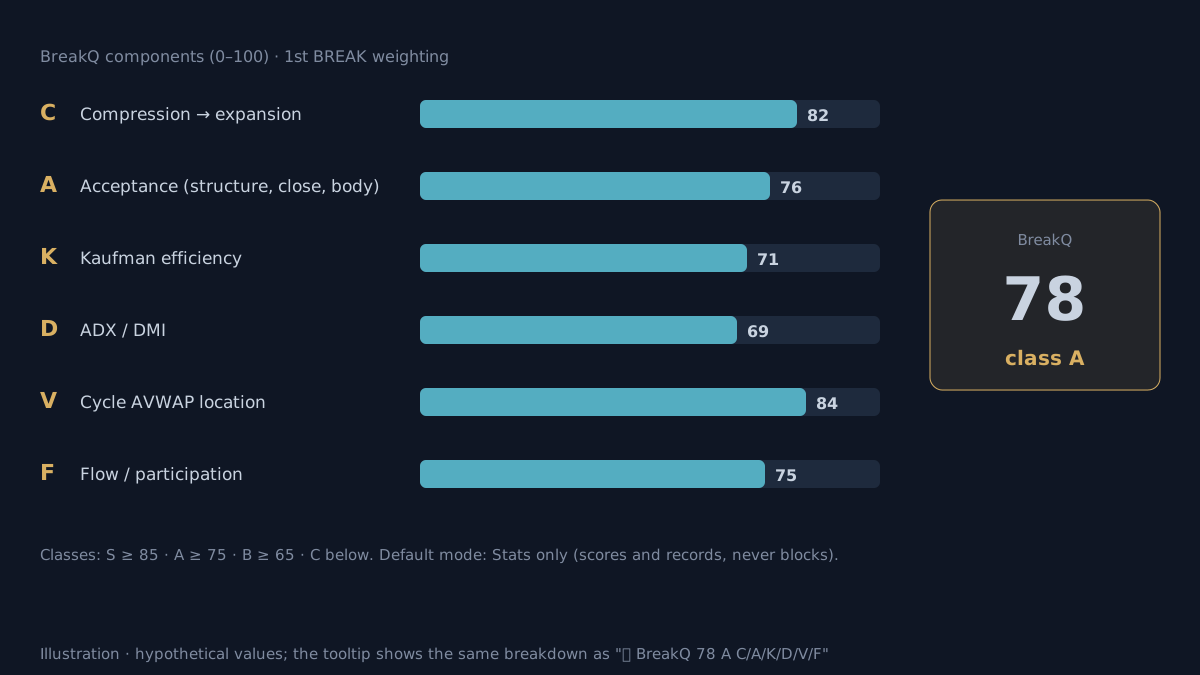 Illustration with hypothetical values.
The BREAK label tooltip shows the same information, for example 🧪 BreakQ 78 A C/A/K/D/V/F 82/76/71/69/84/75.
How does AURORA Pro use Setup Quality?
- Three modes (the Setup Quality mode box):
- Off.
- Stats only (default): scores and records, signals unchanged.
- Filter (experimental): blocks setups below the threshold, 65 by default for both Break and SUNNY.
- Switch each component on or off in the V13 SETUP QUALITY settings group.
- Display:
- The signal label tooltip, with a
🧪 BreakQor🧪 SunnyQline. - The dashboard: a
🧪 Setup Qrow with the current score for BUY and SELL. - JSON: the
setup_qualityfield in alerts. - Strategy Validator: trade names, for example
BREAK-L Q72.
- The signal label tooltip, with a
- Score-bucket analysis is done on the Strategy Validator’s trade list. Group trades by Q bucket (for example below 40, 40–59, 60–74, 75 and above), then compare each bucket’s average R.
- When filtered: the setup shows a ⛔ label with the reason “Break Quality … < 65”.
Validate before filtering
- What to look for: average R that rises steadily from low to high score buckets, and the same pattern repeating across several symbols of the same market type.
- Out-of-sample check: confirm on an out-of-sample period you have not looked at.
- Enough trades per bucket: high-score buckets usually have few trades; a few big winners can create a false difference.
- Measure the filter’s cost: with Filter on, check the ⛔ Filtered row to see whether blocked trades are really worse. Historical results, before costs.
Practical checklist
- Read Setup Quality with Score: Score is about the market, Quality is about the setup.
- Keep Stats only mode until you have enough data.
- Analyse by score bucket: average R should rise from low buckets to high buckets.
- Check several symbols and out-of-sample data before switching on Filter.
- Read each component in the tooltip to see where a low score comes from.
Video Explainer
The video for this article is in production. The full written lesson is already complete.
Video chapters
- Two 1st BREAKs, two outcomes
- How Score and Setup Quality differ
- The six BreakQ components
- SunnyQ and how it is shown
- Validate before filtering
Show transcript
Product documentation
Educational and decision-support content, not investment advice. Chart examples are illustrative or historical and do not guarantee future results. Trading carries a risk of capital loss.