Is a system that wins 70% of its trades necessarily better than one that wins only 40%?
After this lesson you will
- Calculate expectancy per trade in R
- Know the breakeven win rate for each reward:risk ratio
- Read the win rate of a partial take-profit plan correctly
What are win rate and Avg R?
- Win rate: the percentage of trades that make money.
- Average R (Avg R): the average result per trade, in R.
Average R is the expectancy per trade:
Expectancy = Win rate × Average win − Loss rate × Average loss (in R)
For example, a system winning 70% with an average win of 0.3R and an average loss of 1R: 0.7 × 0.3 − 0.3 × 1 = −0.09R per trade. Lots of wins, still losing money.
The breakeven win rate
For a given ratio of average win to average loss (reward : risk), the minimum win rate to break even is:
Breakeven win rate = 1 ÷ (1 + reward:risk)
| Average win : average loss | Breakeven win rate |
|---|---|
| 1 : 1 | 50% |
| 1.5 : 1 | 40% |
| 2 : 1 | 33.3% |
| 3 : 1 | 25% |
These figures are before costs; commission and slippage push the required win rate higher.
Common misunderstandings
- A high win rate means a good system. Without the average win, the number means nothing.
- Below 50% wins is poor. Many trend-following systems win 35–45% and profit because winners are bigger than losers.
- Total profit is enough. Totals depend on trade count; compare systems by average R.
- One good month proves it. You need enough trades; see the Sample size article.
Chart example
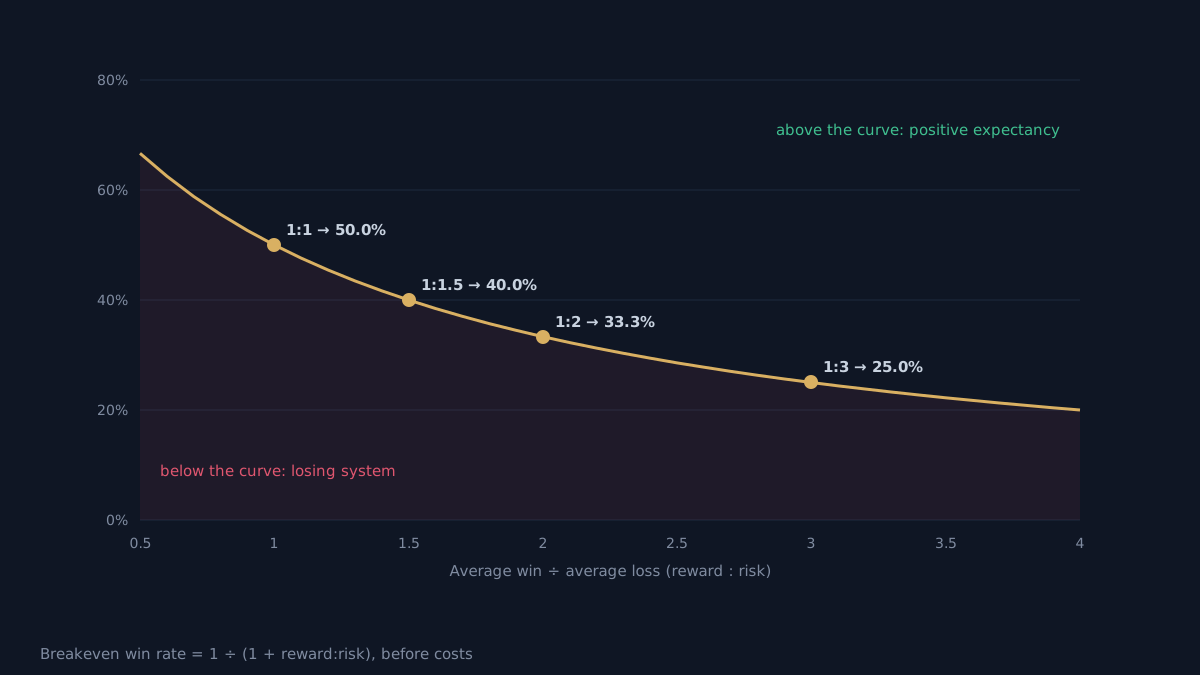 Illustration of the formula, before costs.
How do you read these numbers in AURORA?
AURORA’s default plan closes 50% at TP1 (1R) and 50% at TP2 (2R) and keeps the stop, so each trade has three main outcomes: +1.5R, 0R (TP1 then back to the stop) and −1R. An example with hypothetical numbers:
| Outcome | Share | Contribution |
|---|---|---|
| +1.5R (TP2 reached) | 40% | +0.60R |
| 0R (TP1 then stop) | 15% | 0 |
| −1R (stop) | 45% | −0.45R |
| Expectancy | +0.15R per trade |
The dashboard would show a 40% win rate, because 0R trades do not count as wins, yet the system still has positive expectancy. In practice there are also early exits (EXIT, TIME…) with fractional results; the dashboard includes them all in the Avg figure.
Reading order on the dashboard: trade count → average R (the Total R · Avg row) → how trades exited → win rate last.
Limits
- Expectancy comes from the past. It changes with market phases.
- You need enough trades. +0.15R over 30 trades cannot yet be told apart from 0.
- Costs are excluded when read from the dashboard; use the Strategy Validator for figures after costs.
Practical checklist
- Always read win rate together with the average win and average loss.
- Calculate expectancy per trade in R, after costs.
- Compare the actual win rate with the system's breakeven win rate.
- With partial exits, remember 0R trades do not count as wins.
- Never pick a system just for its high win rate.
Video Explainer
The video for this article is in production. The full written lesson is already complete.
Video chapters
- Is 70% wins always better?
- Expectancy per trade
- The breakeven win rate
- An example with AURORA's plan
- Limits
Show transcript
Product documentation
Educational and decision-support content, not investment advice. Chart examples are illustrative or historical and do not guarantee future results. Trading carries a risk of capital loss.