A profitable system just lost 8 trades in a row: is it broken, or is that normal?
After this lesson you will
- Understand drawdown and maximum drawdown
- Know that long losing streaks are normal, even in profitable systems
- Choose risk per trade from the drawdown you can tolerate
What is drawdown?
Drawdown is the drop in equity from its highest peak to the lowest point that follows, in % or in R. Maximum drawdown is the deepest such drop over the whole test period.
Drawdown answers a question profit does not: how bad does it get before the system recovers?
Losing streaks happen more than you think
Simulating 200 random trades, the probability of at least one long losing streak:
| Loss rate | Streak of 8+ losses | Streak of 10+ losses |
|---|---|---|
| 50% | about 32% | about 9% |
| 60% | about 76% | about 38% |
Trend-following systems often lose 50–60% of their trades. So an 8-loss streak is not evidence that the system is broken.
Risk per trade decides the equity drop
Equity drop after 10 losses in a row:
| Risk per trade | Drop after 10 losses |
|---|---|
| 0.5% | about 4.9% |
| 1% | about 9.6% |
| 2% | about 18.3% |
| 5% | about 40.1% |
And the gain needed to get back to breakeven:
| Drop | Gain needed |
|---|---|
| 10% | 11.1% |
| 20% | 25% |
| 30% | 42.9% |
| 50% | 100% |
Common misunderstandings
- Good systems have no long losing streaks. Streaks are a statistical part of any system with a meaningful loss rate.
- Win it back by increasing size. Raising risk during a drawdown is the fastest way to turn a normal drawdown into a severe one.
- The past maximum drawdown is the worst possible. The future can be worse; leave a safety margin.
- Funded accounts only need profit. Most prop firms set drawdown limits; breaching one loses the account even if the system is profitable long term.
Chart example
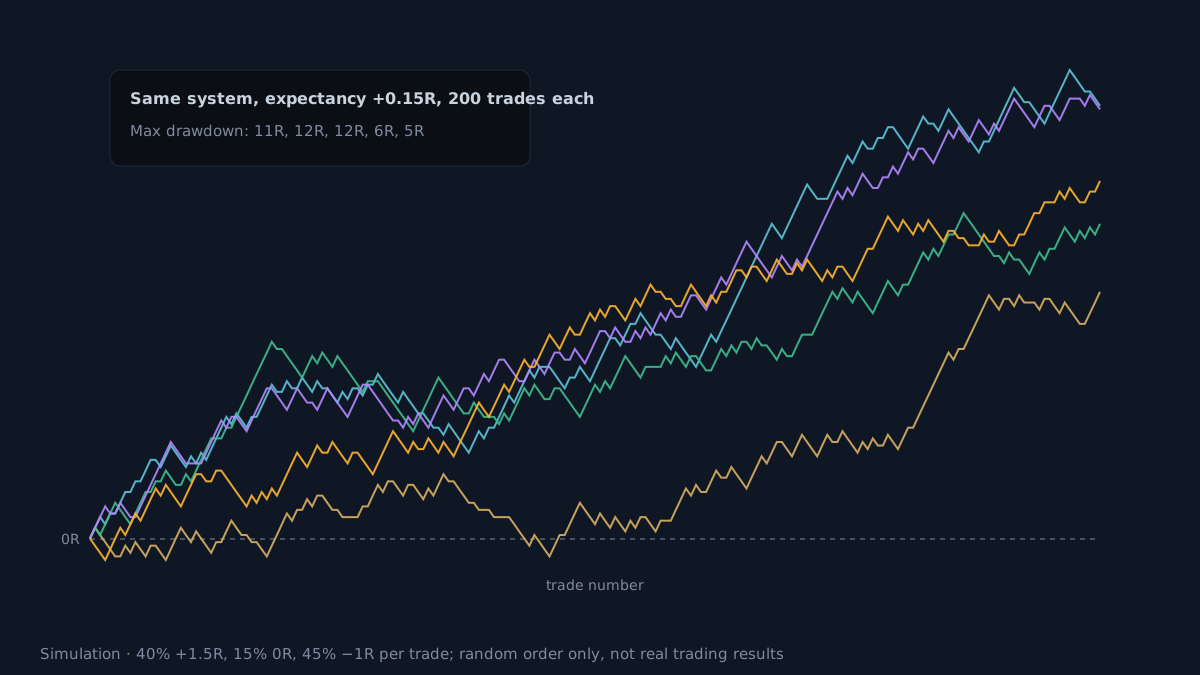 Random simulation, not real trading results. The same system with +0.15R expectancy per trade, differing only in trade order, shows maximum drawdowns from 5R to 12R.
How do you measure drawdown with AURORA?
- The chart dashboard records results in R but does not show drawdown.
- The Strategy Validator reports maximum drawdown in the Strategy Tester, with risk-based sizing, commission and slippage. It is the most accurate place to assess drawdown.
- Suggestion for funded accounts: Trading Style Prop Firm (breakeven after TP1), Entry Filter Profile Strict and Session mode Filter, combined with a small risk per trade.
- Converting: drawdown in R times risk per trade gives the approximate equity drop. For example 12R at 1% risk is about 11–12% of equity.
Limits
- Simulations assume independent trades. In reality losses tend to cluster when market conditions change, so streaks can be longer.
- Drawdown depends on the test period. Test across several years and market conditions.
- Historical results, before costs when read from the chart.
Practical checklist
- Know in advance the maximum equity drop you (or your funded account) accept.
- Pick a risk per trade so that 10 losses in a row stay within that limit.
- Check maximum drawdown in the Strategy Validator, not just profit.
- Never increase size to win back losses during a drawdown.
- Judge a system over months, not over individual winning or losing streaks.
Video Explainer
The video for this article is in production. The full written lesson is already complete.
Video chapters
- 8 losses in a row
- What drawdown is
- Streaks happen more than you think
- Risk % and equity drops
- Measuring drawdown with AURORA
Show transcript
Product documentation
Educational and decision-support content, not investment advice. Chart examples are illustrative or historical and do not guarantee future results. Trading carries a risk of capital loss.