The first breakout just got stopped out. Is the new trend broken?
After this lesson you will
- Understand how AURORA counts breakouts within a trend cycle
- Know why the second breakout deserves separate tracking
- Know what happens to an open 1st BREAK trade when a 2nd BREAK appears
What is the 2nd BREAK?
When the long-term trend filter confirms a new trend cycle, AURORA starts counting how many times price breaks back through the Trailing line in the cycle’s direction and closes on the right side of it:
- First time: the 1st BREAK.
- Second time: the 2nd BREAK.
- From the third time on: no longer treated as a BREAK setup.
When the cycle flips, the count starts over. So a 2nd BREAK always belongs to the same cycle as the 1st BREAK before it.
Why track the second breakout separately?
- The first one is often swept. Right after a trend flip, many stops sit near the Trailing line. Price often sweeps through that area before the real move.
- The trend has survived one test. If the cycle holds after the 1st BREAK fails, the second breakout appears in a trend that has already absorbed one shake-out.
- Different behaviour needs separate statistics. The 1st and 2nd BREAK can perform very differently on the same market.
Common misunderstandings
- “The 2nd BREAK is always better than the 1st.” There is no general evidence for this. On some symbols the first does better, on others the second. Check it with your own data.
- A 2nd BREAK guarantees the trend. The cycle can still flip right after, especially in ranging markets.
- Counting breaks without seeing the cycle start. If the loaded data begins mid-cycle, the “second” breakout you see may really be the third or fourth.
- Skipping the 2nd BREAK because the first just lost. One loss does not break the cycle; this exact situation is why the 2nd BREAK setup exists.
Chart example
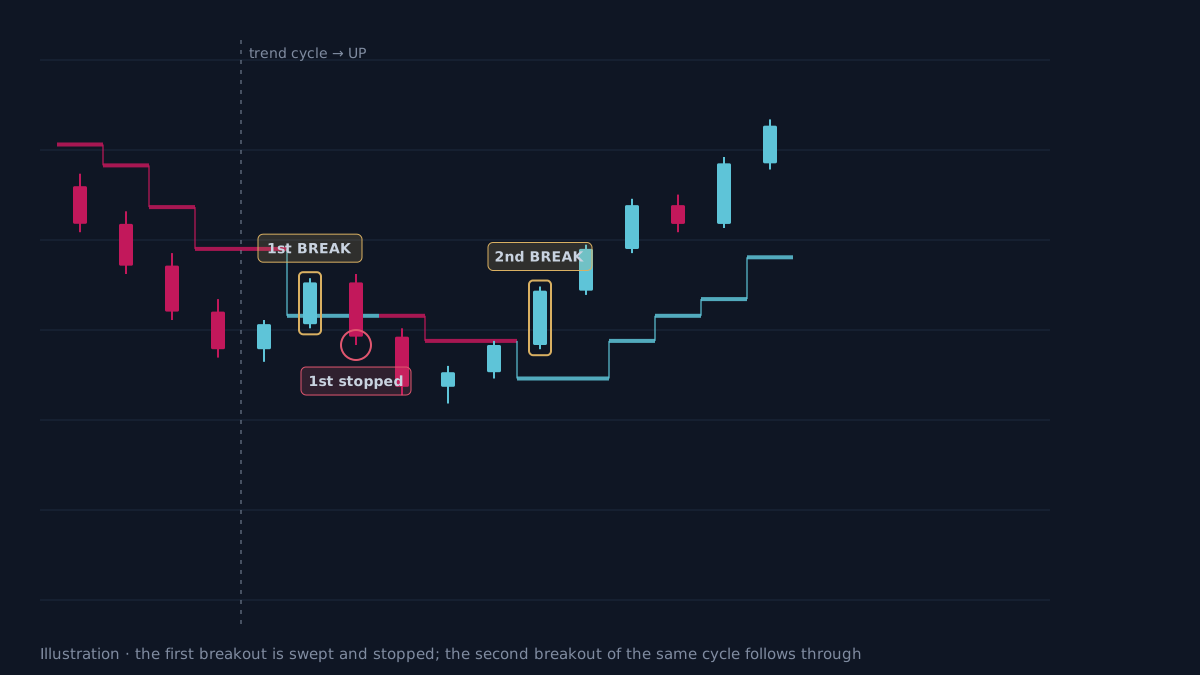 Illustration, not real market data. The first breakout is swept and stopped; the second in the same cycle follows through.
How does AURORA handle the 2nd BREAK?
- The label
⚡ 2nd BREAKappears only once the candle has closed. In AURORA Pro it becomes 💎 when a liquidity sweep happened just before. - The trade plan is identical to the 1st BREAK: the F-SL is the Trailing line at the candle close, TP1 = 1R, TP2 = 2R, same exit policy. A 2nd BREAK candle of 1.8 ATR or longer also uses Pullback Entry.
- On by default (the Trade 2nd Break setup box), sharing the 1st BREAK minimum score (50 by default).
- While a 1st BREAK trade is still open: in the Adaptive exit mode (default), a same-direction 2nd BREAK closes the old trade with a NEXT label and opens a new plan for the 2nd BREAK.
- The LIVE panel (Dashboard Mini) shows the waiting state, for example
⏳ WAITING 2nd BREAK / SUNNY BUY, with the distance to the trigger. - When filtered (low score, filtered session…), a
⛔ 2ndlabel shows with the reason. Filtered trades are still tracked in the background in the ⛔ Filtered row.
Limits of the 2nd BREAK
- Later in the cycle. The remaining move ahead is usually shorter than after a 1st BREAK.
- Rare. At most once per cycle, so it takes a long time to collect enough trades to judge it.
- Ranging markets. Constant cycle flips make both the 1st and 2nd BREAK lose.
- Combined statistics. The dashboard and the Strategy Validator both group the 1st and 2nd BREAK together as BREAK. To compare them, run twice: once with only Trade 1st Break setup on, once with only Trade 2nd Break setup on, keeping every other setting the same. These are historical results, before costs.
Practical checklist
- Count a 2nd BREAK only within the same trend cycle as the 1st BREAK.
- When a 1st BREAK is stopped out, check whether the long-term trend cycle is intact or has flipped.
- Use the same trade plan as the 1st BREAK: stop at the Trailing line, targets in R.
- Consider Pullback Entry if the 2nd BREAK candle is very long.
- Compare BREAK results on the dashboard for the exact symbol and timeframe you trade.
Video Explainer
The video for this article is in production. The full written lesson is already complete.
Video chapters
- The first one just got stopped
- How AURORA counts breaks
- Why the second often runs cleaner
- When a 1st BREAK is still open
- Limits of the 2nd BREAK
Show transcript
Product documentation
Educational and decision-support content, not investment advice. Chart examples are illustrative or historical and do not guarantee future results. Trading carries a risk of capital loss.