In a new trend, why is the first entry often more interesting than later ones?
After this lesson you will
- Understand trend cycles and the first breakout of a cycle
- Tell a 1st BREAK apart from any breakout
- Know why a 2nd BREAK exists and when the setup tends to fail
What is the 1st BREAK?
A trend-following system usually has two layers:
- A long-term trend filter says whether the market is in an up cycle or a down cycle. When it flips, a new trend cycle begins.
- A Trailing line follows price and acts as the short-term invalidation level.
The 1st BREAK is the first time, within the new cycle, that price breaks back through the Trailing line in the direction of the cycle and closes on the right side of it. The second time is the 2nd BREAK. When the cycle flips again, the count starts over.
So a 1st BREAK is not just any breakout: it only means something after a confirmed trend cycle.
Why does the first breakout matter?
- Early in the cycle. If the new trend continues, the remaining move ahead is usually the longest.
- A clear invalidation level. The Trailing line at the signal candle gives a concrete stop, so 1R is known before entry.
- Less guessing. A fixed counting rule replaces the feeling that “the trend seems to have changed”.
Common misunderstandings
- “The 1st BREAK always wins.” No setup does. It is a structured entry, not a promise about the outcome.
- Counting without seeing the cycle start. If the loaded data starts mid-trend, the first breakout you see may not be the first of the cycle.
- Chasing an overly long breakout candle. Entering at the end of a very long candle means a distant stop and a likely pullback.
- Ignoring context. A low trend score, a thin session or major news all make the setup less reliable.
Chart example
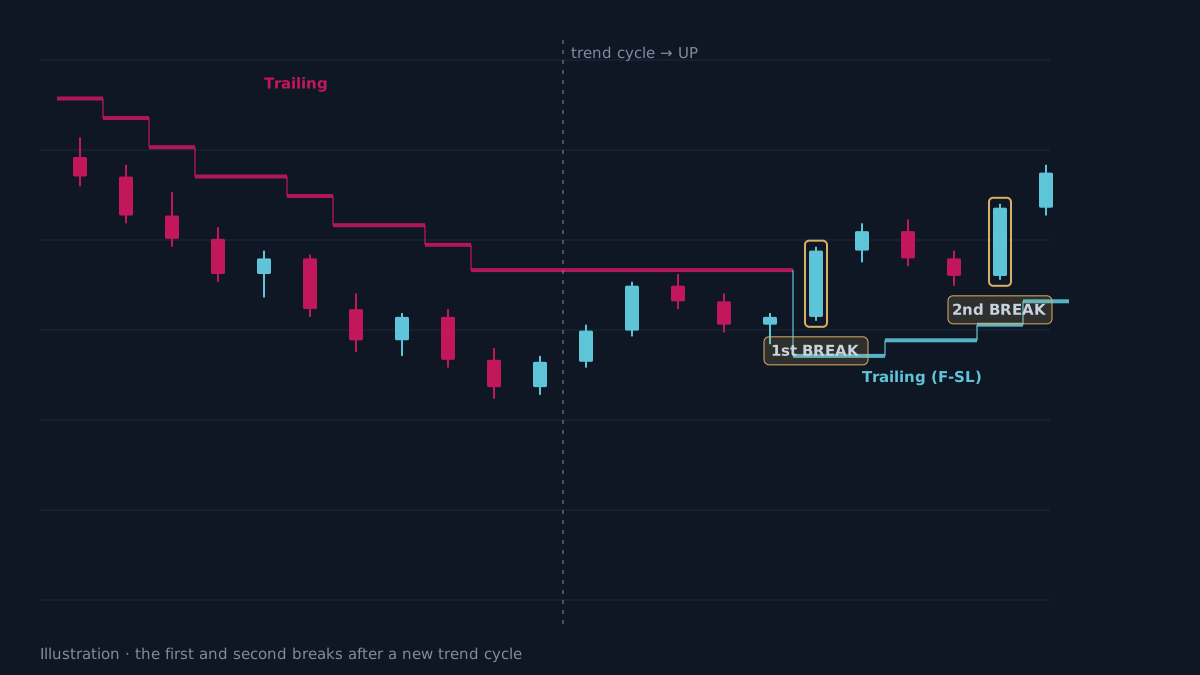 Illustration, not real market data. The Trailing line changes colour when the cycle flips; gold boxes mark the first two breakout candles.
How does AURORA identify the 1st BREAK?
In AURORA Standard and AURORA Pro, the 1st and 2nd BREAK are the core setups:
- The
⚡ 1st BREAKor⚡ 2nd BREAKlabel appears only once the candle has closed. - The F-SL is the Trailing line value at the signal candle; TP1 and TP2 are set in R.
- When the breakout candle is 1.8 ATR or longer, AURORA places a limit order at the 50% retracement instead of entering immediately (Pullback Entry).
- If the data has no cycle start yet, the dashboard shows a warm-up state and does not label a 1st BREAK.
- Setups blocked by a filter (low score, filtered session…) show a ⛔ label with the reason. In AURORA Pro the label becomes 💎 when a liquidity sweep happened just before.
When does the 1st BREAK fail?
- Ranging markets. The trend filter keeps flipping, and each short cycle produces a breakout that then loses.
- Swept breakouts. Price clears the Trailing line, triggers entries, then reverses. This is why the 2nd BREAK is tracked separately.
- News-driven volatility. A news candle can produce a “clean” breakout that does not reflect a real trend.
- Different markets behave differently. How the 1st BREAK performs on gold H1 says nothing about Bitcoin M5. Read the statistics on the exact symbol and timeframe you trade, after costs.
Practical checklist
- Confirm the trend cycle has flipped before looking for the first breakout.
- Count a signal only when the candle has closed on the right side of the Trailing line.
- Know the stop and 1R before you enter.
- With an overly long breakout candle, consider waiting for a pullback instead of chasing.
- Check this setup's statistics on the exact symbol and timeframe you trade.
Video Explainer
The video for this article is in production. The full written lesson is already complete.
Video chapters
- The first entry of a trend
- Trend cycles and the Trailing line
- Why there is a 2nd BREAK
- The 1st BREAK in AURORA
- When the setup fails
Show transcript
Product documentation
Educational and decision-support content, not investment advice. Chart examples are illustrative or historical and do not guarantee future results. Trading carries a risk of capital loss.