The breakout candle just ran a very long way: enter now, or wait for a pullback?
After this lesson you will
- Calculate 1R for an immediate entry and for a limit order at the 50% retracement
- Know the conditions that cancel the limit order
- Understand why waiting for a pullback is not always better than entering now
What is Pullback Entry?
When a breakout candle is overly long, instead of entering at its close you place a limit order at a partial retracement of the candle, for example 50% (its midpoint). The stop stays where it was.
- Price pulls back: the order fills; you enter at a better price with a smaller 1R.
- Price does not pull back: the order expires or is cancelled, and you stay out.
Why is an overly long breakout candle a problem?
Example of a buy, with ATR at 3.2. The breakout candle has a high of 107.6, a low of 100.9 and closes at 107.4: a range of 6.7, about 2.1 ATR. The Trailing line (the stop) is at 99.6.
| Enter now | Wait for 50% | |
|---|---|---|
| Entry | 107.4 | 104.25 |
| Stop | 99.6 | 99.6 |
| 1R | 7.8 | 4.65 |
| TP1 (+1R) | 115.2 | 108.9 |
| TP2 (+2R) | 123.0 | 113.55 |
For the same money at risk, the pullback order allows about 1.7 times the size, and the targets are much closer. The longer the breakout candle, the farther the stop and the more likely price retraces part of the thrust.
Common misunderstandings
- Waiting is always better. No. The strongest thrusts often never come back, so the limit order misses exactly the big winners. Meanwhile it fills more easily on deep pullbacks that keep falling.
- Every candle deserves a pullback order. For a normal breakout candle the retracement level is close to the close and the benefit is tiny; entering now is simpler.
- Chasing after expiry. Chasing once the order is cancelled brings back the original problem.
- Forgetting to resize. A smaller 1R means sizing on the new 1R; otherwise real risk differs from the plan.
Chart example
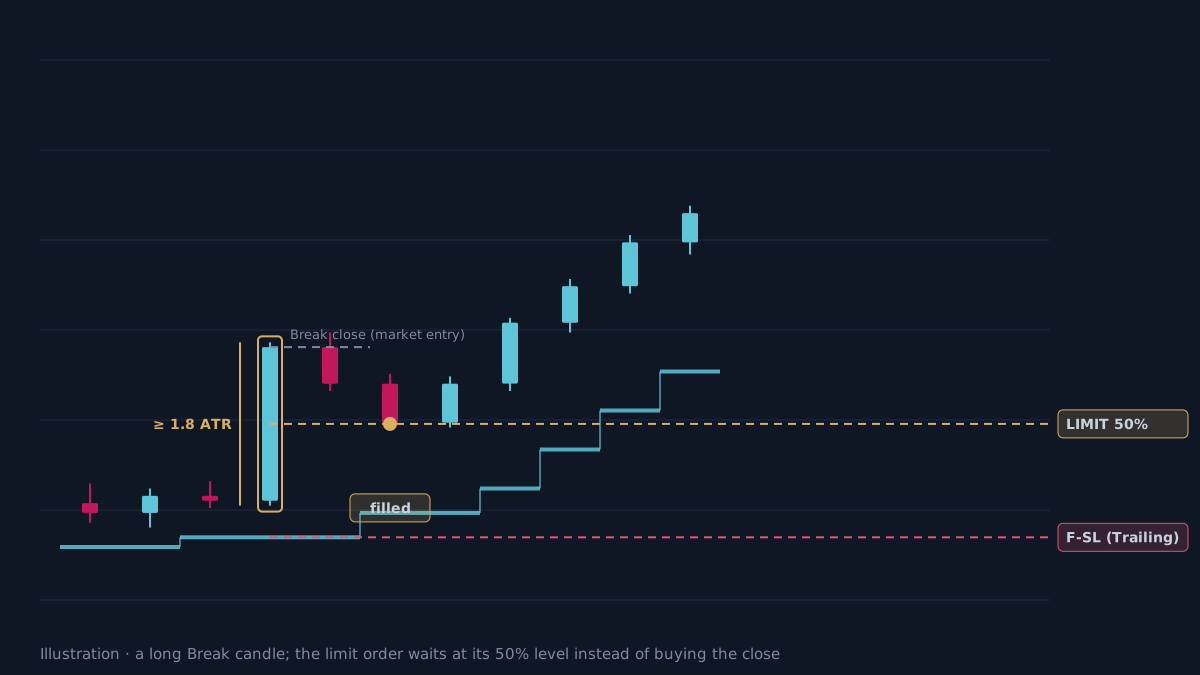 Illustration, not real market data. The breakout candle is longer than 1.8 ATR; the limit order fills two candles later.
How does AURORA use Pullback Entry?
In AURORA Standard and AURORA Pro, Pullback Entry applies to the 1st / 2nd BREAK setups:
- When: a BREAK candle with a range of 1.8 ATR or more. Normal BREAK candles still enter immediately, as in the original setup.
- Limit level: 50% of the BREAK candle (can be changed to 38.2% for a shallow or 61.8% for a deep pullback). A
⏳ LIMITlabel shows on the chart with the bars remaining. - Stop: by default the Trailing line at the BREAK candle, as in the original setup (alternative: beyond the BREAK candle’s high / low). TP1 and TP2 are recalculated from the fill price.
- Validity: at most 6 bars. In AURORA Pro the Trading Style adjusts this: Scalping 4, Intraday 6, Swing 3, Prop Firm 6.
- Cancelled when: it expires; price runs more than 1R from the BREAK close; the Trailing trend flips; an opposite signal appears; or another trade has opened.
- Fills: if a candle opens beyond the limit (a gap), the fill is at the open, a better price. If price touches the stop on the fill candle itself, the trade counts as stopped out immediately.
- JSON alerts for bots:
PLACE_LIMITwhen the order is placed andCANCEL_LIMITwhen it is cancelled (with the reason), sharing oneorder_id. - Measuring it: the ⏳ Pullback row on the dashboard (Full layout) shows fills / orders placed, win rate, and compares the R of waiting with a reference trade entering immediately at the BREAK close.
- AURORA Pro only: an option to place the limit at the midpoint of a fresh FVG (FVG CE) instead of a percentage, off by default.
The cost of waiting
- Adverse selection. Limit orders fill more often when price genuinely turns and less often on strong runs. The win rate of filled trades can therefore be lower than you expect.
- Fewer trades. Some signals never fill, so it takes longer to build a usable sample.
- Fill assumptions. On the chart, an order counts as filled when price touches the limit. In reality price may need to trade a few ticks through it. The Strategy Validator’s Verify price for limit orders setting lets you test this.
- Decide with data. If the ⏳ Pullback row shows lower R than the reference trade on the symbol you trade, simply turn Pullback Entry off. These are historical results, before costs.
Practical checklist
- Measure the breakout candle in ATR before deciding to enter now or wait.
- Place the limit order with its stop attached, and size it on the new (smaller) 1R.
- Give the limit order an expiry; when it expires, cancel it rather than chase.
- Cancel the order if price runs more than 1R straight away or the trend flips.
- Compare waiting against entering now on your own data before trusting either.
Video Explainer
The video for this article is in production. The full written lesson is already complete.
Video chapters
- An overly long breakout candle
- Enter now vs wait: comparing 1R
- The limit order in AURORA
- When the order is cancelled
- The cost of waiting
Show transcript
Product documentation
Educational and decision-support content, not investment advice. Chart examples are illustrative or historical and do not guarantee future results. Trading carries a risk of capital loss.