Once you have missed the breakout at the start of a trend, is there a rule-based way in without chasing price?
After this lesson you will
- Understand the logic of a continuation entry after a pullback
- Tell SUNNY apart from the 1st and 2nd BREAK
- Know the conditions AURORA checks before entering a SUNNY trade
What is SUNNY?
SUNNY is a with-trend continuation setup. The general idea, not specific to AURORA:
- The market is in a confirmed trend cycle.
- Price makes a pullback against the trend.
- Short-term momentum turns back in the main direction, and the signal candle closes on the right side of the Trailing line (above it in an uptrend, below it in a downtrend).
- The market is not ranging and volatility is not compressed.
When all four hold, you have a rule-based entry inside a running trend, with a clear stop.
Why enter after a pullback?
- No chasing. Entering after a pullback usually gives a better price than entering in the middle of a strong move.
- The trend is confirmed. Unlike an entry at the start of a cycle, the trend has already shown it exists.
- A clear invalidation level. If price closes through the Trailing line, the “trend continues” idea is wrong.
Common misunderstandings
- SUNNY is bottom-picking. No. SUNNY only enters with the main trend, after momentum has returned; it does not guess the low of the pullback.
- Every pullback is an opportunity. If the pullback closes through the Trailing line, the trend may be weakening; it is no longer a SUNNY.
- SUNNY and BREAK are the same. A BREAK is price breaking back through the Trailing line at the start of a cycle, counted only twice per cycle. SUNNY happens inside the cycle, possibly many times.
- Ignoring stop distance. Late in a long trend, the Trailing line can sit far from price, making 1R large and reward to risk worse.
Chart example
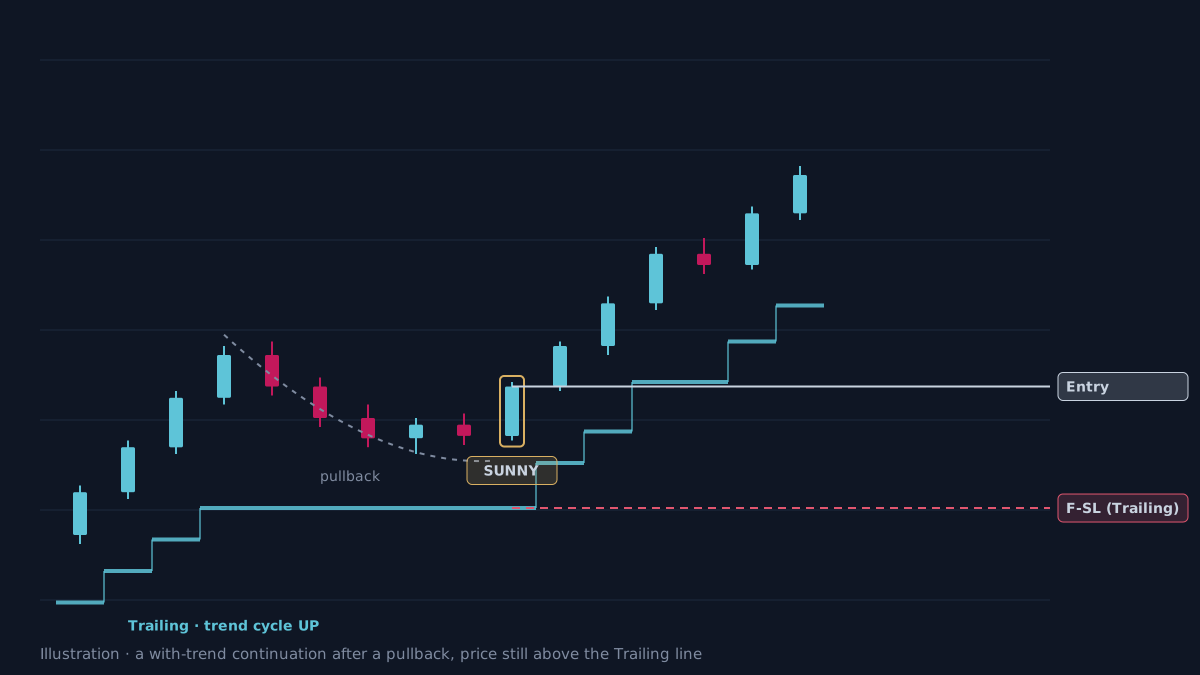 Illustration, not real market data. The dashed curve is the pullback; the gold box is the SUNNY signal candle.
Price holds above the Trailing line throughout the pullback. When momentum turns up and the candle closes, the trade enters at the close, the F-SL sits on the Trailing line, and TP1 and TP2 are set in R.
How does AURORA identify SUNNY?
In AURORA Standard and AURORA Pro, SUNNY is the system’s second core setup, next to the 1st / 2nd BREAK:
- The label
☀ SUNNYappears only once the candle has closed, with the score in the tooltip. - The trade plan matches BREAK: the F-SL is the Trailing line at the signal candle, TP1 = 1R, TP2 = 2R, with the same exit policy.
- Minimum score defaults to 50. In AURORA Pro it follows the Entry Filter Profile (Core parity 50, Balanced 55, Strict 60).
- Ranging filter: the signal is skipped when the long-term trend lines are not clearly separated or volatility is compressed.
- Priority: if a 1st / 2nd BREAK and a SUNNY appear on the same candle, the BREAK wins. Two same-direction SUNNY signals must be at least 3 bars apart.
- With a same-direction trade open: SUNNY shows a
+ADDlabel (an optional add-on sharing the original SL / TP) instead of opening a new plan. - Separate statistics in the ☀ SUNNY row of the dashboard. AURORA Pro adds a SunnyQ score (statistics only), a SUNNY-specific volume filter (off by default), and a
⛔ SUNlabel with the reason when the setup is filtered.
Without AURORA you can still apply the idea with any trend-following dynamic stop and a clear rule for “momentum has returned”.
When does SUNNY underperform?
- Ranging markets. The filter removes many, but not all, choppy periods.
- Late in a trend. After several continuations, the odds of a cycle flip rise while the stop is far away.
- Deep pullbacks. When the pullback comes close to the Trailing line, a normal swing can stop the trade out.
- Markets differ. Compare the ☀ SUNNY row with the ⚡ Break row on the exact symbol and timeframe you trade. These are historical results, before costs.
Practical checklist
- Confirm the main trend cycle first, then look for a pullback to join it.
- Enter only when the candle closes on the right side of the Trailing line.
- Skip it when the market is ranging or volatility is compressed.
- Check the distance to the stop: a long-running trend often means a large 1R.
- Track SUNNY statistics separately from BREAK on the exact symbol and timeframe you trade.
Video Explainer
The video for this article is in production. The full written lesson is already complete.
Video chapters
- Missed the first breakout?
- Continuation after a pullback
- How SUNNY differs from BREAK
- The conditions in AURORA
- When SUNNY underperforms
Show transcript
Product documentation
Educational and decision-support content, not investment advice. Chart examples are illustrative or historical and do not guarantee future results. Trading carries a risk of capital loss.