The question
The dashboard shows a 52% win rate: what does that number say, and what does it not?
After this lesson you will
- Understand what each statistics row on the dashboard measures
- Read in order: trade count, average R, exits, and only then win rate
- Know what the dashboard leaves out: costs, slippage and add-on signals
What does the statistics dashboard measure?
Every signal entered in AURORA has a trade plan: entry, F-SL, TP1, TP2 and exit rules. When the plan ends, the result is recorded in R and added to the dashboard. Statistics cover all loaded chart history for the exact symbol and timeframe open.
The main rows:
| Row | Meaning |
|---|---|
| 📈 Stats | Total trades and win rate. A trade counts as a win when its result is above 0R; a 0R trade is not a win. |
| Hit rate | Share of trades reaching TP1 and TP2. |
| Total R · Avg | Total R and average R per trade. |
| 🚪 Exits | How trades closed: TP2, BE (breakeven), SL, EXIT (Trailing flip), TIME (holding limit), REV (reversal or replaced by a new Break). |
| ⚡ Break · ☀ SUNNY | Results for each setup. AURORA Pro adds 💠 SMC and RETEST / SWEEP / IFVG sub-rows. |
| 🅰 Grade A · 🅱 Grade B | Smart signal results by grade (when Trading mode includes Smart). |
| ⛔ Filtered | Ghost trades: BREAKs blocked by a filter but still tracked in the background. |
| ⏳ Pullback | Limit-order entries versus a reference trade entering immediately (Full layout). |
| Session rows | Results by session at entry, when Session is on. |
Why does average R matter more than win rate?
- Win rate is half the story. Winning 70% with small average wins and full 1R losses can still be a losing system.
- Average R combines both. A positive average R over enough trades is the best sign the dashboard can give.
- Total R depends on trade count. A group of 100 trades at +10R is worse than a group of 20 trades at +8R. Compare groups by average R.
Common misunderstandings
- Statistics are a forecast. No. They are past results on that exact chart, before costs and slippage.
- Every signal is counted. AURORA keeps one trade plan at a time. A same-direction signal while a trade is open shows
+ADDand is not counted as a separate trade. - Loading more history leaves the numbers unchanged. How many bars load depends on your TradingView plan; more history changes the statistics.
- Comparing across symbols is fair. Every symbol and timeframe behaves differently. Only compare configurations on the same symbol and timeframe.
Chart example
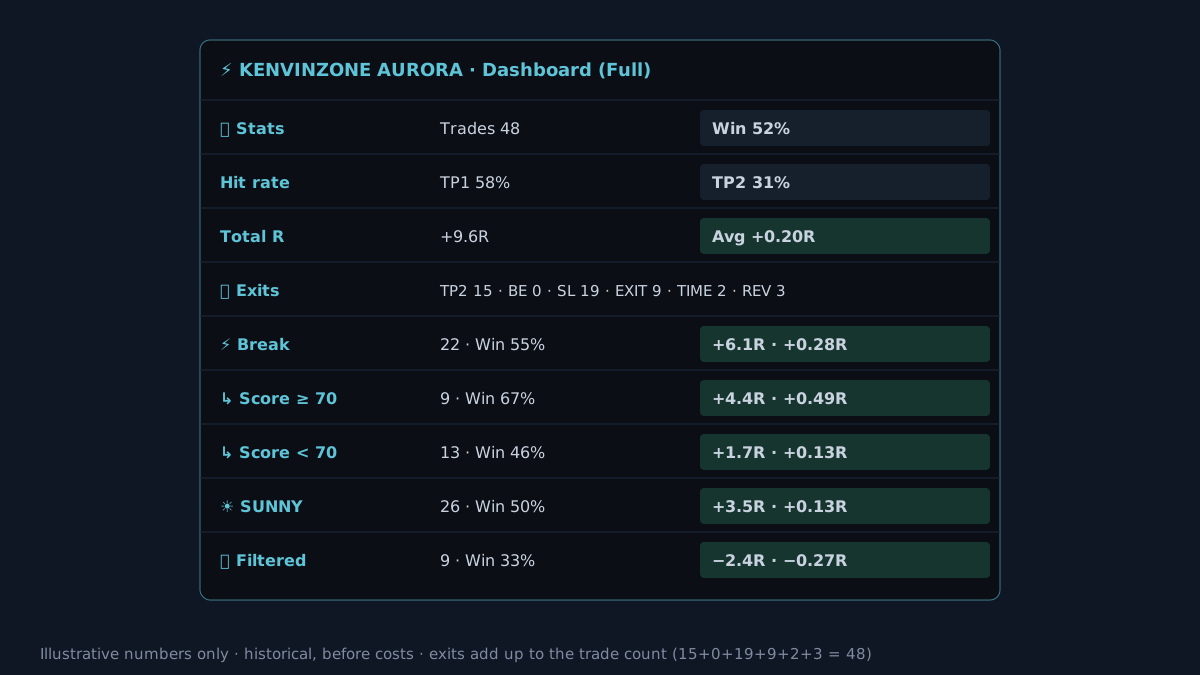 Hypothetical numbers to show how to read it, not real results.
Reading the example in order:
- Trade count: 48 trades in total, 22 Break, 26 SUNNY. The “Score ≥ 70” group has only 9 trades, too few to conclude anything.
- Average R: +0.20R per trade overall. Break at +0.28R beats SUNNY at +0.13R.
- Exits: 19 stop-outs, 15 trades reached TP2. No BE because setups keep the stop by default.
- The filter: ⛔ Filtered at −0.27R: the blocked BREAKs really were worse than the ones taken.
- Only then win rate: 52%.
How does AURORA show its statistics?
- Layout: the Dashboard layout box has three options.
- Mini is the LIVE panel for phones, without statistics. AURORA Standard V12.2 defaults to Mini.
- Compact has the statistics, without the 9-timeframe table.
- Full has everything; it is the default in AURORA Pro.
- Statistics are separate from drawings: turning off the drawn trade plans keeps the statistics (the Track trade-plan statistics box).
- Results in R: they match the result label on each trade, for example
✓ +1.5R · TP2. - Conservative counting: if one candle touches both the stop and a target, the trade counts as stopped out.
- AURORA Pro only: splits Break results into Score ≥ 70 and < 70, and adds Runner, Sweep and current setup-quality rows.
What the dashboard leaves out
- Commission and slippage. With tight stops, costs can eat a large part of 1R. Use the Strategy Validator for figures after costs.
- Drawdown and losing streaks. The dashboard does not show the deepest equity drop; the Validator’s Strategy Tester does.
- In-sample bias. If you tune settings while watching the dashboard, the result is fitted to that very data. Recheck on a different period.
- Sample size. A few dozen trades can look very different from a few hundred. Past results do not guarantee future results.
Practical checklist
- Switch the dashboard to Compact or Full; the Mini layout is a LIVE panel without statistics.
- Read the trade count first: below roughly 20–30 trades per group, do not draw conclusions.
- Compare groups by average R per trade, not by total R.
- Check the Exits row to see where trades usually close.
- Confirm with the Strategy Validator, including costs, before using real money.
Video Explainer
The video for this article is in production. The full written lesson is already complete.
Video chapters
- What a 52% win rate says
- Turn on a layout with statistics
- Each dashboard row
- The order to read in
- What the dashboard leaves out
Show transcript
The dashboard shows a 52% win rate. That alone does not say whether the system is good, because it says nothing about how much each winner made and each loser lost.
AURORA's dashboard records the result of every trade plan on the loaded chart history, in R: total trades, TP1 and TP2 hit rates, total R, average R, how trades closed, and results for each setup.
Read in order: trade count first, then average R, then how trades exited, and only then the win rate.
And remember these are historical results, before commission and slippage. The Strategy Validator is the next check.
Product documentation
Educational and decision-support content, not investment advice. Chart examples are illustrative or historical and do not guarantee future results. Trading carries a risk of capital loss.