How do you know objectively, rather than by feel, that the short-term trend has broken?
After this lesson you will
- Understand the principle of a pivot- and ATR-based trailing stop
- Read the colours, diamonds, dots and T-SL label on the chart
- Know where the Trailing line is used across AURORA's setups
What is the Kenvin Super Trailing line?
Kenvin Super Trailing is AURORA’s dynamic stop line, developed from the KENVIN CLOUD system. It belongs to the family of ATR-based trailing stops, alongside popular SuperTrend-style indicators, with three traits:
- Built from pivot points: the line is anchored on confirmed swing highs and lows, plus or minus a multiple of ATR. Its distance from price therefore adapts to the market’s volatility.
- Step-shaped, one direction only: in an uptrend it sits below price and is only pulled up; in a downtrend it sits above price and is only pulled down.
- Flips when a candle closes through it: a wick through the line is not enough. When it flips, the line jumps to the other side of price.
Why is a dynamic stop useful?
- An objective answer. Whether the short-term trend is up or down is decided by a rule, not a feeling.
- Adapts to volatility. In volatile markets the line sits farther back; in quiet markets it hugs price.
- A ready-made invalidation level. It gives a sensible stop loss for trend trades and locks in profit as it is pulled along.
Common misunderstandings
- The Trailing line is a profit target. No. It is an invalidation level: where the trend idea is considered wrong.
- A wick touching the line is a reversal. Only a candle close through the line counts as a flip.
- T-SL and F-SL are the same. T-SL is the line’s current value and changes every bar. F-SL is the fixed stop of the open trade, set at the entry candle.
- The line redraws the past. Pivot points need a few bars to confirm, so the line reacts with some delay. In exchange, values on closed bars are not redrawn.
Chart example
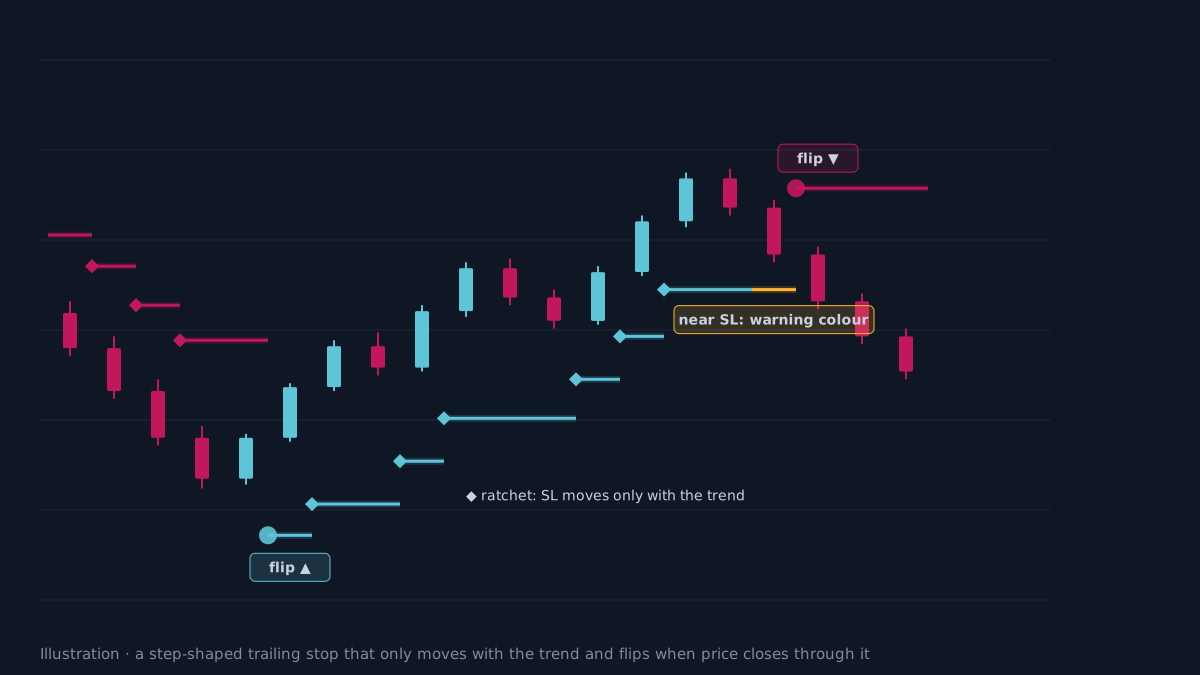 Illustration, not real market data. Diamonds mark each pull of the line; dots mark flips; the orange segment shows price approaching the line.
How does AURORA show the Trailing line?
On the chart:
- Colour: green in an uptrend, pink in a downtrend (following the Theme). As price comes within about 0.5–3 ATR of the line, it shifts gradually to an orange warning colour.
- Small diamonds: each time the line is pulled in the trend direction.
- Dots: the points where the line flips.
- The
🛡 T-SLlabel on the right edge: the line’s current value and the % risk if you entered at the current price. - The Kenvin cloud: the shaded area between the Baseline and the Trailing line.
In the system:
- BREAK trigger: the 1st / 2nd BREAK is price breaking back through the Trailing line in the cycle’s direction.
- Default stop: the F-SL of BREAK and SUNNY is the line’s value at the signal candle.
- Exits: EXIT when the line flips (Adaptive mode); the AURORA Pro Runner trails its stop along the line.
- Scoring: the line’s direction is part of the Trend family in the Score.
Settings: the CORE TREND SETTINGS group has two boxes:
- Pivot sensitivity (4 by default).
- ATR factor: small hugs price, suited to scalping; large sits farther back, suited to swing trading.
The AURORA Pro Trading Style never overrides them.
When is the Trailing line noisy?
- Ranging markets. The line flips repeatedly, each flip producing a signal that tends to lose. This is why AURORA adds a long-term trend filter.
- Late in a long trend. After a strong run the line can sit far from price, making the 1R of a new trade very large.
- News and gaps. A news candle can close through the line and reverse straight away.
- Changing the ATR factor. Every past signal and statistic changes with it. Compare on the exact symbol and timeframe you trade before keeping a new factor.
Practical checklist
- Count a flip only when a candle closes through the line, not when a wick touches it.
- Use the Trailing line as an invalidation level, not a profit target.
- Tell T-SL (dynamic, changes every bar) apart from F-SL (fixed for the open trade).
- A small ATR factor suits low timeframes, a large one suits high timeframes; recheck statistics after changing it.
- When the line sits far from price, weigh the large 1R before entering.
Video Explainer
The video for this article is in production. The full written lesson is already complete.
Video chapters
- Has the trend broken?
- Pivots, ATR and steps
- Reading colours and markers
- Its role in AURORA's setups
- When the Trailing line is noisy
Show transcript
Product documentation
Educational and decision-support content, not investment advice. Chart examples are illustrative or historical and do not guarantee future results. Trading carries a risk of capital loss.